
The short answer
An industrial history becomes clearer when the unit of the claim is explicit. These records concern trading, company establishment, assembly relationships and first vehicles; they are not a verified annual production series.
Record comparison
Compare the evidence
Keep the objects and assumptions attached to each statement.
| Item | What it establishes | What remains separate |
|---|---|---|
| Company establishment | An organisational milestone in the cited account. | Not automatically a first completed vehicle. |
| First unit | A product event under a specified scope. | Not a yearly production series. |
| Vehicles per day | A rate with an operating-day denominator. | Not total annual output without a period and observations. |
Chronology
A timeline of the turning points
Establishment account
Vehicle-company date in the citation.
Product account
First-vehicle date in company chronology.
Assembly account
First Ford Rangers reported.
Separate company and product milestones
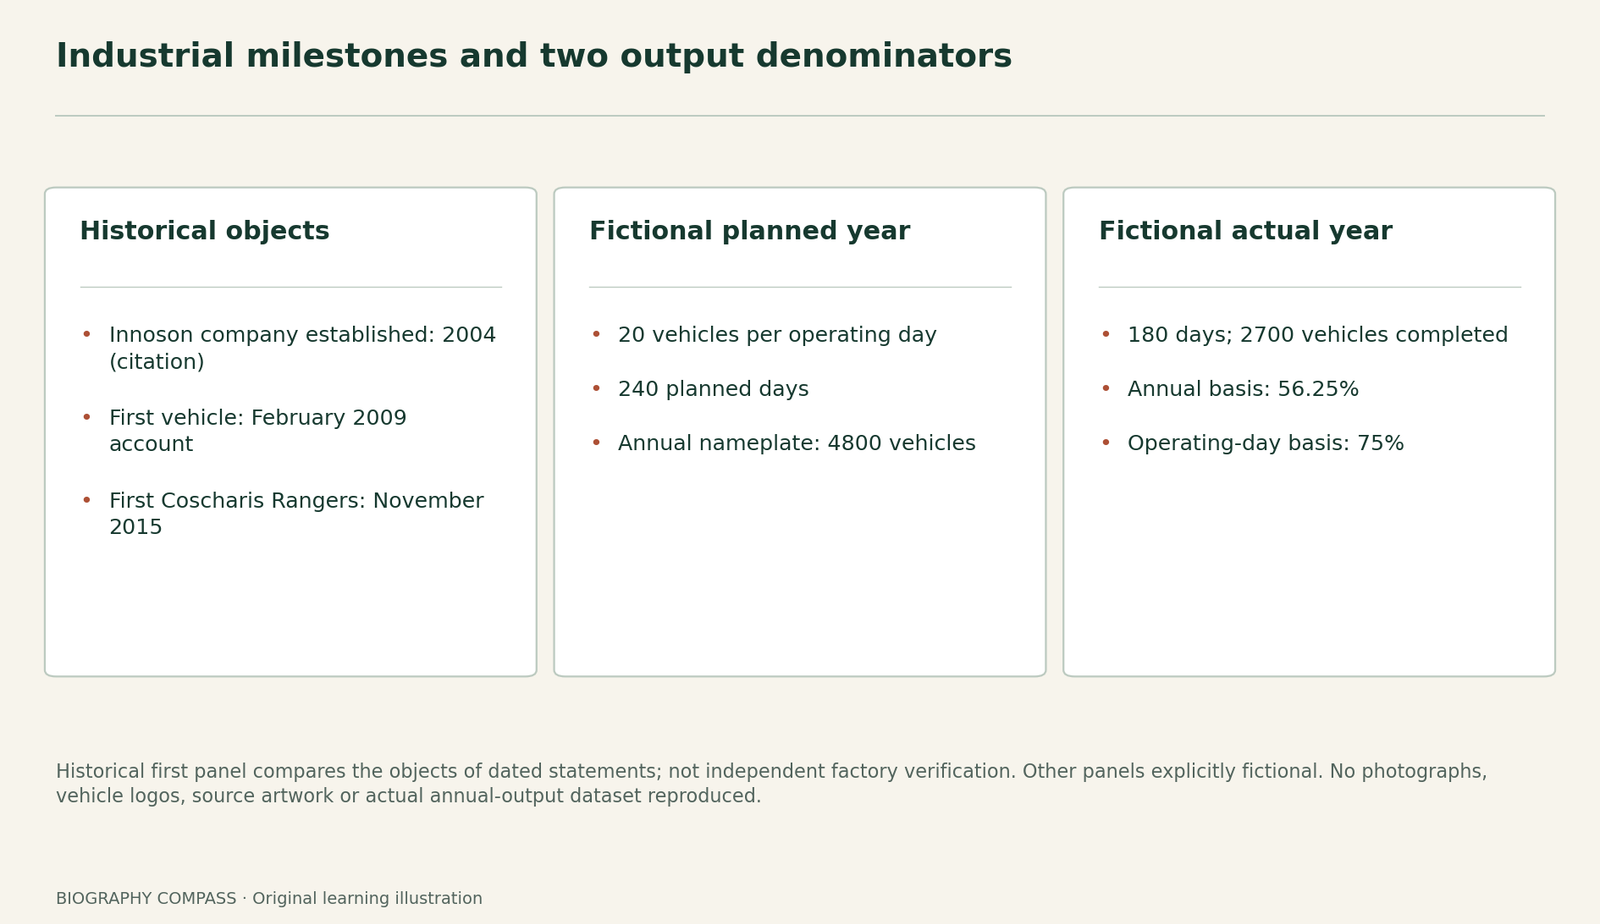
The Zik Prize citation dates Innoson’s vehicle company establishment to 2004.
The manufacturer’s January 2016 chronology separately attaches February 2009 to a first vehicle, after earlier motorcycle and plastics stages.
Those sentences have different objects: an organisation’s establishment and a product milestone. They need not contradict each other. Neither selected paragraph supplies the number of vehicles completed during a particular full year, and the award citation is not an inspected corporate-registration certificate.
Identify the assembly relationship precisely
Coscharis’s page dates its assembly company to 2014 and its first Ford Rangers to November 2015. It calls the operation an assembler and describes Ford equipment, technical support and training for a semi-knocked-down plant.
A contemporary P.M. News report records the company’s first-vehicle announcement and a planned ten vehicles per day.
A first unit is an event. A projected daily rate is a capacity or operating-plan statement. Neither establishes a completed annual total. The company page retains a plan to launch another plant in 2016; this should not be mistaken for a verified present operating status.
Compare what the records can establish
The records reveal different business pathways, not a race decided by whichever date is earliest. Keep the company, vehicle type, industrial process and document date attached to each claim. An assembler’s relationship with an international brand differs from the brand’s ownership; an entrepreneur’s presence in both trading and manufacturing does not make every stage the same operation.
For a stronger output comparison, one would need matching periods, scope and a definition of completed units, with a series or other appropriate production evidence. The selected accounts do not provide that series. This is a limit of the evidence inspected, not a claim that no such records exist anywhere.
Test two denominators with invented factory data
For a fictional plant, stipulate a nameplate rate of 20 completed vehicles per operating day and a planned 240-day year. It actually operates for 180 days and completes 2700 vehicles. Define annual nameplate utilisation as completed vehicles divided by planned annual capacity. Define operating-day throughput utilisation as completed vehicles divided by capacity for the days actually operated. No inventories, rework or alternative product weights are supplied.
Task: calculate both percentages and explain why they differ. These are invented inputs, not Innoson or Coscharis output figures.
Reference answer: planned annual capacity is 20 × 240 = 4800 vehicles. The annual utilisation measure is 2700 ÷ 4800 = 56.25%. Capacity over actual operating days is 20 × 180 = 3600 vehicles, so the second measure is 2700 ÷ 3600 = 75%. Actual throughput averages 15 vehicles per operating day. The gap arises because the denominators differ. It does not identify why the plant operated fewer days or demonstrate product quality, domestic component content or business profitability.
Continue the chronology
Related history guides
FirstBank and Access: Which Board?
Compare another way these business records distinguish their objects and measures.
Read the timeline2024 offering recordsZenith’s 2024 Offer: Par Value and Price
Compare another way these business records distinguish their objects and measures.
Read the timelineBiography context
Explore Nigeria through connected lives
Connected biographies
People connected with these records
Born 1961
Innocent Chukwuma
Manufacturer and Innoson founderChukwuma developed Innoson from trading into manufacturing businesses.Read biography
Born 1958
Cosmas Maduka
Industrialist and Coscharis founderMaduka developed Coscharis through trading, distribution and industrial ventures.Read biographyQuick answers
Common questions
- Does a planned daily rate prove annual output?
- No. A rate and a completed count require matching periods and evidence of what occurred.
- Do the fictional utilisation measures prove poor management?
- No cause is supplied. The calculation distinguishes denominators; it does not diagnose the business.
Primary and institutional sources
How this history was checked
Read these records alongside their dates, stated objects and access limits. The exercise and worked answer are original learning material. This article was reviewed on 30 October 2026.