
The short answer
What did Edith Clarke’s graphical calculator help engineers solve?
Compare the evidence
Clarke’s Calculator: A Model on a Chart
Compare what each inspected record establishes with the claim that remains separate.
| Record or observation | What it supports | What remains separate |
|---|---|---|
| Patent’s modelling discussion | Explains why long-line calculations need a different representation | Does not make the chart suitable for every electrical network |
| Professional career history | Connects the aid with demanding power-system analysis | Does not turn a graphical instrument into a digital computer |
A long line changes the modelling problem
Clarke's calculator patent concerns the electrical characteristics of long transmission lines. Its opening explains that assumptions concentrating capacity and inductance at a few isolated points, useful for shorter lines, become inadequate as line length increases. The specification uses hyperbolic functions to represent long-line behaviour. This is not merely a faster way to add a list of numbers; the calculation must first represent the physical system at the appropriate scale.
Sources for this section: [3]
A graphical aid represents an equation
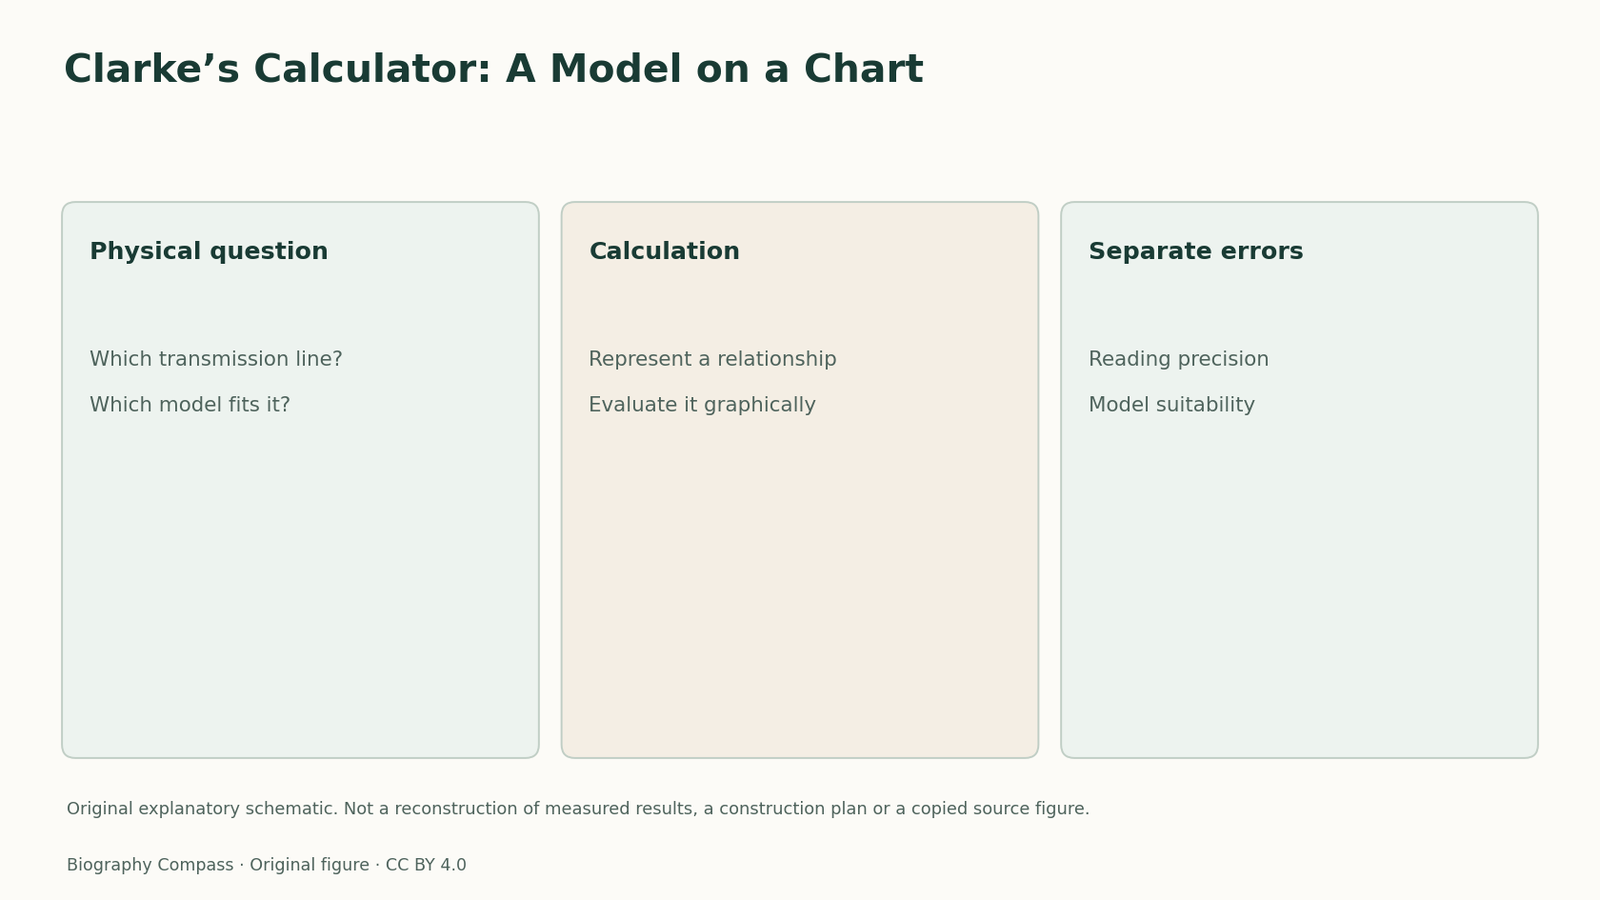
The calculator turns relationships needed in transmission-line analysis into a graphical form. A chart can make a mathematical relation easier to evaluate, but it does not decide whether that relation fits a particular real network. Clarke's broader engineering history connects calculation methods with the increasing demands of power-system analysis. Reading the patent beside that history distinguishes the mathematical model, the aid used to evaluate it and the actual line whose behaviour an engineer wants to understand.
Separate chart reading from model validation
For an original classroom exercise, provide an invented graph relating two quantities and ask a reader to estimate an output for a marked input. Then change the imagined physical system while keeping the graph unchanged. Ask whether a precise reading of the old graph proves the new system has been modelled correctly. It does not. The answer separates reading error from model suitability. This activity does not reproduce Clarke's chart or supply a real transmission-line calculation. It explains why making a calculation convenient is valuable while leaving the choice and validation of its underlying model as separate engineering work.
Continue the chronology
Related history guides
Biography context
Explore United States through connected lives
Connected biographies
People behind the records
1883–1959
Edith Clarke
Electrical engineer and power-system analystGraphical calculation methods for long transmission lines and power-system analysis.Read biography1884–1981
Shinji Sogo
Railway administrator and Japanese National Railways presidentInstitutional leadership and financing of the Tokaido Shinkansen project.Read biography1909–1990
Beatrice Shilling
Aeronautical engineer and carburettor researcherThe RAE restrictor and research on aircraft fuel-metering systems.Read biographyQuick answers
Common questions
- What did Edith Clarke’s graphical calculator help engineers solve?
- Clarke’s graphical calculator helped evaluate relationships used for long transmission lines. Its convenience did not remove the need to choose equations and assumptions appropriate to the actual network.
Primary and institutional sources
How this history was checked
Sources distinguish individual patent or technical records from biographical and retrospective accounts. Their actual reading scope is retained in the biography source notes. This article was reviewed on 7 November 2026.