
The short answer
A fluorescence ratio can reduce some measurement problems, but it is not automatically a concentration. Grynkiewicz, Poenie and Tsien’s 1985 paper makes the missing calibration terms visible. This learning guide works through the equation and an invented example, rather than offering a laboratory protocol.
Original source comparison
What information does a ratio carry?
Keep measured signals, calibration and model assumptions visible.
| Country | What the evidence supports | What it does not establish |
|---|---|---|
| Common multiplier | An ideal common factor can cancel in a ratio | All noise, motion or channel differences disappear |
| Additive background | Subtract each channel’s relevant background first | Background automatically cancels after division |
| Calibration terms | Endpoint ratios, Kd and intensity factor define the inference | A ratio alone determines a universal concentration |
Chronology
A timeline of the turning points
Indicator paper
The original paper presents spectra and calibration equations.
Ratio-to-concentration model
Printed page 3447 identifies endpoint and binding terms.
Separate fictional inputs
Two calculations demonstrate why R alone is insufficient.
The original paper compared more than brightness
A new generation of Ca2+ indicators with greatly improved fluorescence properties appeared in the Journal of Biological Chemistry, volume 260, pages 3440–3450. The author-laboratory-hosted scan was consulted for selected spectra, calibration discussion and equations. The paper examines several indicators, including fura-2, and how their fluorescence changes with calcium binding. Its measurements depend on specified conditions. For example, the displayed apparent dissociation constants for fura-2 include different values under different conditions. A number copied without its medium and calibration context is therefore not a universal conversion factor for every cell or instrument.
Sources for this section: [1]
Equation 5 contains more than the measured ratio
On printed page 3447 the paper gives [Ca2+] = Kd × ((R − Rmin)/(Rmax − R)) × (Sf2/Sb2). R is a fluorescence ratio measured at two wavelengths; Rmin and Rmax describe calibrated endpoint ratios. Kd is the relevant dissociation constant, while Sf2/Sb2 accounts for the change in fluorescence at the second wavelength between the calcium-free and bound forms. The equation assumes a simple binding model and appropriate calibration behaviour. Its use does not follow from having two arbitrary brightness values. In particular, a ratio cannot remove the need to identify the indicator and conditions under which the calibration was established.
Sources for this section: [1]
Background must be handled before forming the ratio
The same discussion warns that autofluorescence and other background signals must be subtracted before the ratio is taken. A common multiplicative change can cancel in an ideal ratio: 1,000/500 and 500/250 both equal 2. Additive contributions behave differently. If measured signals of 1,000 and 500 contain backgrounds of 100 and 0 respectively, the corrected ratio is 900/500 = 1.8. All those numbers are invented illustrations. The example does not show that every real multiplicative effect is common to both channels, or that the two measurements remain stable while they are acquired.
Sources for this section: [1]
Original exercise: supply all the stipulated terms
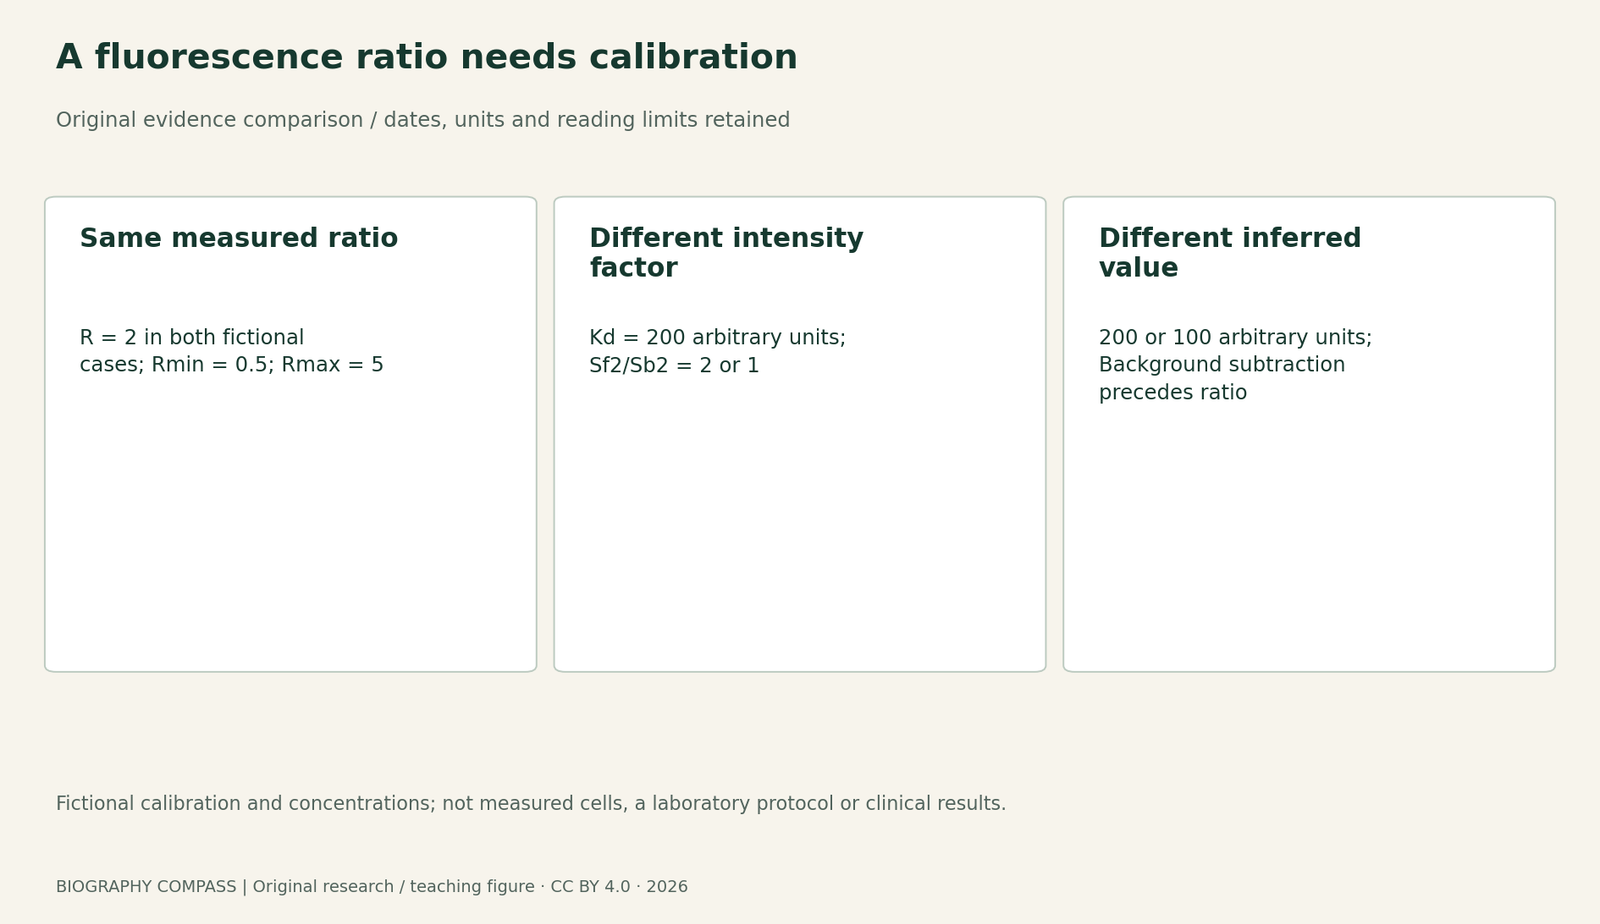
Use a deliberately fictional calibration: R = 2, Rmin = 0.5, Rmax = 5, Sf2/Sb2 = 2 and Kd = 200 arbitrary concentration units. Calculate the concentration within this model. Repeat with the same ratio and endpoints but Sf2/Sb2 = 1. Explain why the answers differ. Next consider what happens to the denominator as R approaches Rmax. Decide whether the equation then provides trustworthy evidence that a real cell contains an infinite concentration. Finally identify why combining Kd from one medium with endpoints measured under another is not justified merely because both sources name the same indicator.
Sources for this section: [1]
Reference answers identify what the ratio leaves out
The first calculation is 200 × (1.5/3) × 2 = 200 arbitrary concentration units. The second is 100 units. Thus the same R can imply different values when another calibration term differs. As R approaches Rmax, the denominator tends to zero, making the inferred result highly sensitive to measurement error. That mathematical behaviour is not an observed infinite concentration. The paper’s later discussion notes the increasing noise problem at high calcium. The binding and measurement assumptions must remain applicable; mixing terms from incompatible conditions removes that basis. The fictional units deliberately avoid presenting this exercise as a measured biological sample or a clinical result.
Sources for this section: [1]
Keep molecular design, measurement and interpretation separate
Tsien’s biography connects chemical probe design with biological questions, while his Nobel lecture addresses fluorescent proteins as another research programme. A calcium-sensitive probe and a GFP expression marker should not be described as the same measurement. Finish by annotating the equation: which terms came from the sample reading, which from calibration and which depend on a model? The equation supports a conditional inference when those inputs are appropriate. It does not supply the missing instrument settings, sample preparation, uncertainty assessment or validation for a new experiment. Reading a technical achievement this way makes its contribution more specific and more useful than a general claim that a brighter image reveals everything inside a cell.
Continue the chronology
Related history guides
Chalfie’s Worm Research: Anatomy, Expression and Function
Compare a different measurement question and its explicitly bounded worked exercise.
Read the timeline1985–1992 research; 2014 participant lecturesBlue LEDs: GaN Growth and p-Type Conduction Were Different Barriers
Compare a different measurement question and its explicitly bounded worked exercise.
Read the timelineBiography context
Explore United States through connected lives
Connected biographies
People behind the work

1952–2016
Roger Y. Tsien
Chemist and biological-imaging researcherRoger Y. Tsien was an American chemist who designed molecules to investigate activity inside cells. His research ranged from calcium indicators to improved fluorescent proteins, connecting chemical structure with the kinds of biological questions that researchers could measure.Read biographyQuick answers
Common questions
- Are 200 and 100 actual cell calcium measurements?
- No. They are results from an explicitly fictional calibration with arbitrary units.
- Was the whole 1985 paper experimentally reproduced?
- No. Selected pages of the original scan were read; no new experiment or independent replication is claimed.
Primary and institutional sources
How this history was checked
Compare the identified original texts, participant accounts and institutional records; the teaching examples are separately labelled. This article was reviewed on 27 October 2026.
- Grzegorz Grynkiewicz, Martin Poenie and Roger Y. Tsien; author-laboratory hosted scanA new generation of Ca2+ indicators with greatly improved fluorescence properties,JBC260,3440–3450,1985
- Roger Y. Tsien; Nobel FoundationConstructing and Exploiting the Fluorescent Protein Paintbox,8 December 2008,186–214
- Roger Y. Tsien; Nobel FoundationRoger Y. Tsien: autobiographical account,2008