
The short answer
When a distant supernova looks faint, what evidence helps tell dust and distance apart?
Read the evidence
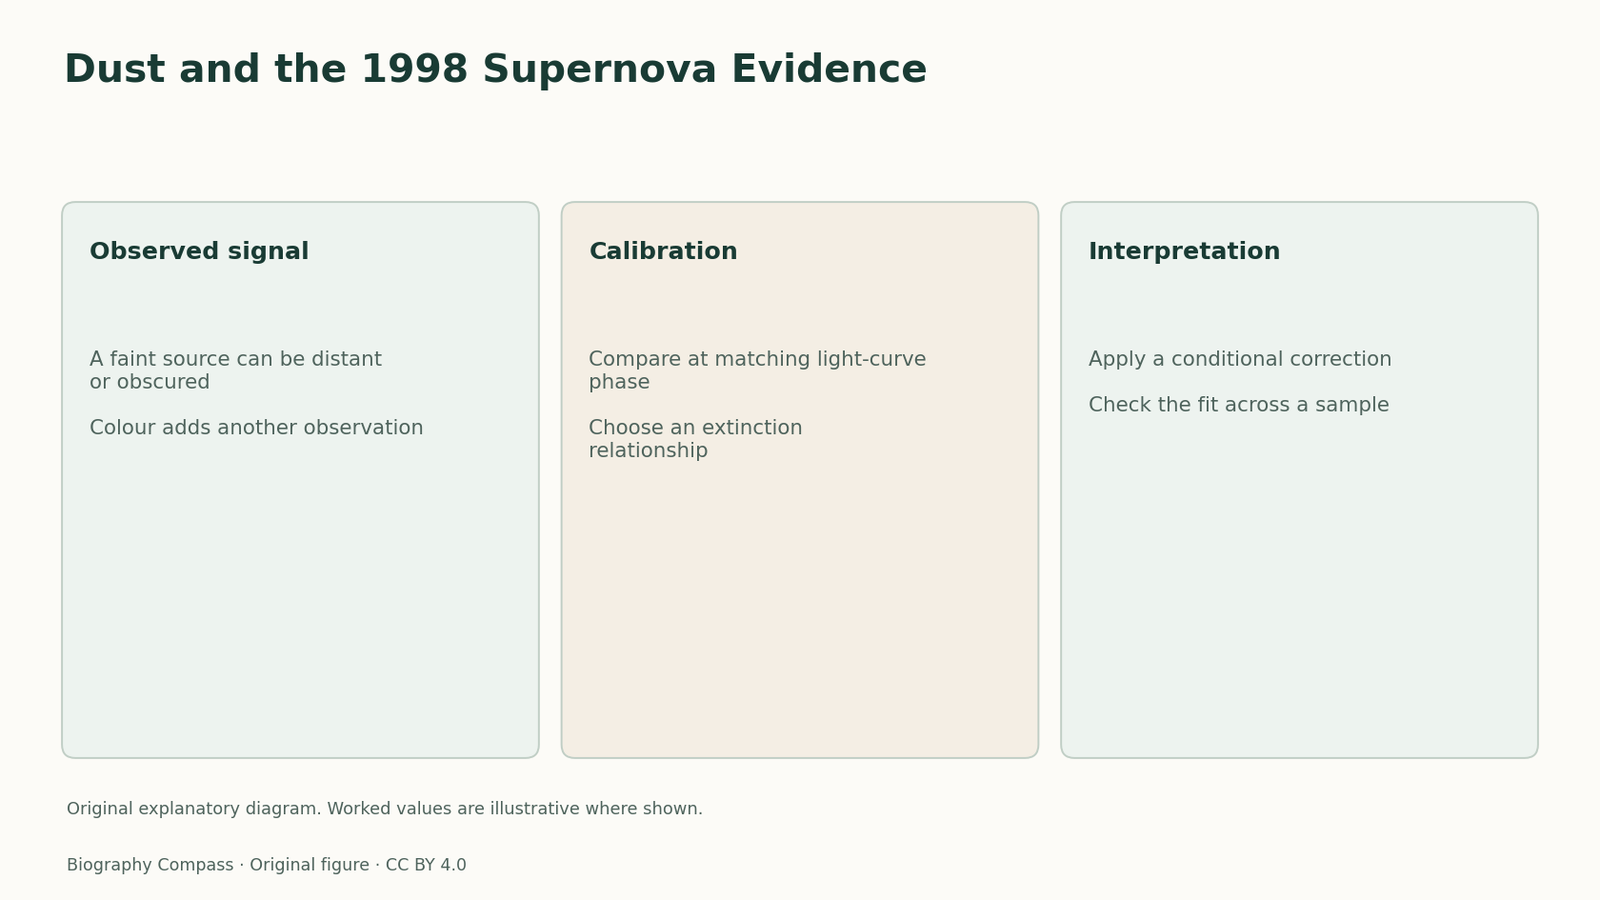
What colour adds to brightness
A distance estimate combines several observations and assumptions.
| Evidence | Potential meaning | Check |
|---|---|---|
| One faint measurement | Distance or attenuation can explain it | Use other bands and phases |
| Redder observed colour | Dust or intrinsic colour variation | Compare with a calibrated light curve |
| Residual after fitting | May change a distance estimate | Test the sample and alternative models |
Two routes to a faint supernova
Distance spreads a source’s light over a larger area. Intervening dust can also make an object look faint by absorbing or scattering part of that light. A single brightness measurement leaves these possibilities entangled. Ordinary dust tends to affect shorter visible wavelengths more strongly, so an object may also appear redder. But Type Ia supernovae can differ intrinsically in colour and luminosity. The useful observations therefore combine timing, colour and brightness. The challenge is to infer what the source would have looked like without extinction before turning the apparent brightness into a distance.
The light curve supplies a reference
A light curve describes how brightness changes with time. Its shape helps standardise Type Ia supernova luminosities and helps constrain intrinsic colour. The 1998 paper compared distance estimates from two fitting methods. It describes correcting foreground Milky Way extinction and estimating an additional effect associated with host galaxies. A colour difference is not directly a dust measurement in isolation. It must be compared with the colour expected for a supernova at the relevant stage and interpreted through an assumed relationship between colour excess and extinction. Uncertainty in those choices belongs in the result.
An invented two-band example
Suppose a calibrated light-curve model predicts a colour index of zero at a certain phase, and a distant supernova has a measured index of 0.10 magnitudes. In a classroom rule, assume every 0.10 magnitude of colour excess implies 0.30 magnitude of dimming in the band used for distance. An apparent dimming of 0.40 would leave 0.10 after that correction. If the source is intrinsically 0.05 magnitudes redder than predicted, the inferred dust contribution falls. These numbers are invented. They illustrate why the assumed intrinsic colour and the adopted extinction rule both influence a distance estimate.
How the 1998 result was bounded
The paper analysed 16 distant supernovae together with 34 nearby ones. The distant group appeared roughly 10 to 15 percent farther away on average than the authors’ specified low-density model without a cosmological constant. That percentage is a model comparison, not a direct measurement of an acceleration percentage. The authors examined extinction alongside possible evolution, sample selection, local motions and other effects. Their analysis found that the tested systematic explanations did not reconcile the sample with the non-accelerating models they considered. This is more specific than saying every conceivable dust population was eliminated.
Sources for this section: [2]
What a reader should inspect
A useful reading separates the flux measurement from the correction and the final cosmological fit. Ask which bands were observed, what the light-curve comparison says about intrinsic differences and how much of the distance estimate changes under alternate treatments. A form of dust that attenuates several bands almost equally would be harder to diagnose by colour alone. Independent wavelength measurements and the way residuals change across redshift can then supply additional evidence. That is why a systematic test accompanies the discovery rather than becoming redundant once a fitted acceleration appears.
Continue the chronology
Related history guides
Finding Supernovae in Batches
Follow the Supernova Cosmology Project’s search sequence from reference images to spectra, and work through a scheduling example for a short-lived target.
Read the timeline1992Distances from Expanding Supernova Photospheres
Work through the expanding photosphere method with radius, angular size and dilution, then read the scope of Schmidt, Kirshner and Eastman’s 1992 study.
Read the timeline1990s–2001The Hubble Key Project’s Distance Ladder
Trace how the Hubble Key Project calibrated Cepheids, checked five secondary indicators and combined measurements of the expansion rate in 2001.
Read the timelineBiography context
Explore United States through connected lives
Connected biographies
Researchers and collaborators
1969–
Adam Riess
Observational cosmologistFollow Adam Riess from MIT and Harvard to the High-z Supernova Search Team, including his work on supernova colours, distance and cosmic expansion.Read biography1967–
Brian Schmidt
Astronomer and research leaderTrace Brian Schmidt from Arizona and Harvard to Mount Stromlo, covering his Type II distance method and leadership of the High-z supernova team.Read biography1959–
Saul Perlmutter
Experimental cosmologistExplore Saul Perlmutter’s career, the role of Carl Pennypacker and the Berkeley collaboration, and how scheduled searches made distant supernovae useful.Read biographyQuick answers
Common questions
- Can colour alone give a dust correction?
- It needs a reference intrinsic colour and an assumed extinction law.
- Does the 10–15 percent describe acceleration itself?
- It describes mean distance differences from a specified comparison model.
Primary and institutional sources
How this history was checked
Dates, legal milestones and historical claims are checked against the official and institutional records below. This article was reviewed on 13 November 2026.