
The short answer
How did a project observing nearby variable stars produce an estimate of expansion on much larger scales?
Read the evidence
Follow the calibration
Use one row for the input and another for the question that follows.
| Step | Input | What it helps determine |
|---|---|---|
| Anchor | Adopted distance and local Cepheids | Calibrated Cepheid luminosities |
| Secondary methods | Galaxies with Cepheid distances | Distances beyond the Cepheid range |
| Expansion estimate | Calibrated distance and recession velocity | A value with shared and separate uncertainties |
Why a ladder needs an anchor
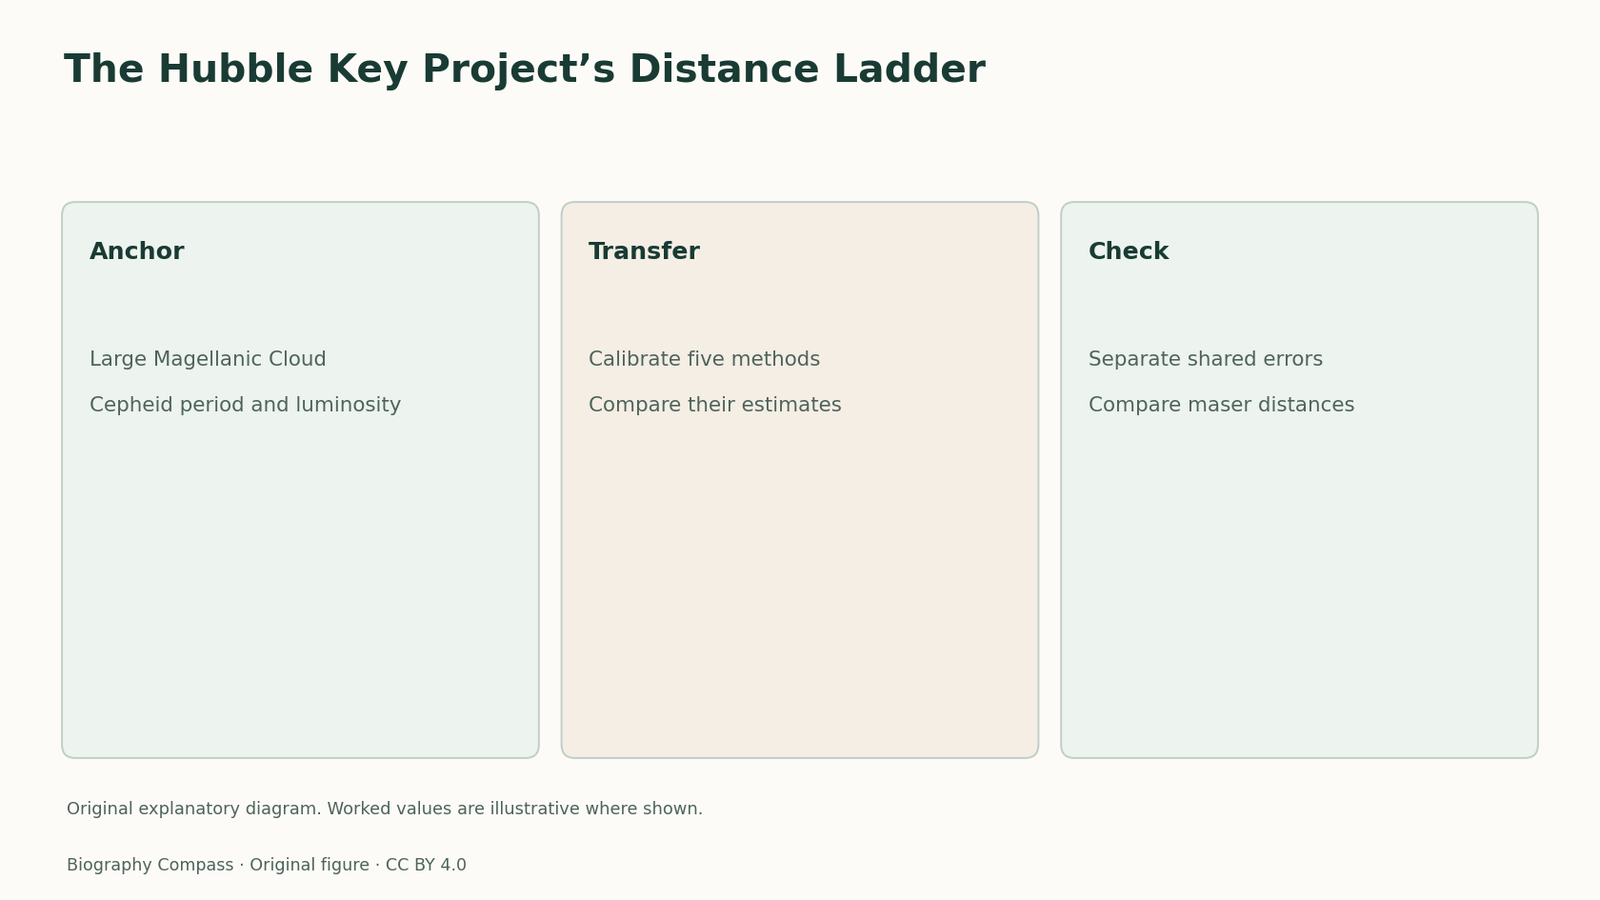
A Cepheid pulsates with a period related to its luminosity. Observing its period and brightness can therefore give a distance if the luminosity relation has been calibrated. The Key Project’s final analysis adopted a distance of about fifty kiloparsecs to the Large Magellanic Cloud and used its Cepheids in the calibration. The anchor matters because the distances inferred for other galaxies inherit that starting scale. An error in an adopted distance can move several results together. Measuring additional Cepheids can improve sampling without removing an error common to the calibration.
Sources for this section: [2]
From Cepheids to distant indicators
Cepheids observed in other galaxies provided calibration distances for indicators that can be measured farther away. The paper compares five methods, including Type Ia and Type II supernovae, the Tully–Fisher relation, surface-brightness fluctuations and the fundamental plane. Each has a different observable and different sources of scatter. The calibrated scale can then be applied to galaxies whose velocities better trace expansion over the sampled region. Individual galaxies also have local motions. Sampling a suitable range of distances helps separate the expanding pattern from departures associated with particular locations or systems.
What a common uncertainty means
An uncertainty shared by two indicators stays relevant when they are averaged. Consider two invented methods that both return seventy. Each has small individual measurement scatter. Both used the same anchor distance, which later turns out to have been underestimated. Revising that distance upward would lower both estimates of expansion rate if the velocities stayed fixed. Their initial agreement could be genuine while the shared scale still needed revision. The example explains why a result table should distinguish uncertainties belonging to one method from those inherited from common inputs.
Sources for this section: [2]
Read the final result in its own units
The final paper reported seventy-two plus or minus eight kilometres per second per megaparsec for the combined estimate. The units describe the recession speed associated with an extra megaparsec of distance under a simple nearby expansion relation. For a classroom check, multiplying seventy-two by ten gives seven hundred and twenty kilometres per second at ten megaparsecs, before any local motion is considered. That illustrative conversion is separate from the actual galaxy sample. The published uncertainty also applies to an estimate, so the central value should be read with the calibration and assumptions stated in the paper.
Sources for this section: [2]
Compare a separate distance check
The project tested its revised Cepheid calibration against the maser-based distance to NGC 4258. The paper reported improved agreement after the recalibration. The value of that comparison is that a maser measurement uses different physical observations from the period and brightness of a Cepheid. A shared zero point can connect many methods while making some errors difficult to isolate. A separately established distance can expose a problem that internal agreement alone would leave hidden. To read the ladder as evidence, mark which comparisons share an anchor and which have a more independent basis.
Continue the chronology
Related history guides
Leavitt’s 1912 Table: Period and Brightness
Compare the columns in Leavitt’s 1912 Cepheid table and use an original exercise to see why a shared distance and a separate calibration both matter.
Read the timelineLate 1980s–1999Finding Supernovae in Batches
Follow the Supernova Cosmology Project’s search sequence from reference images to spectra, and work through a scheduling example for a short-lived target.
Read the timeline1998Dust and the 1998 Supernova Evidence
Explore how the High-z team estimated dust effects from colour and light curves, and why its 1998 paper still treated extinction as a systematic uncertainty.
Read the timeline1993How STS-61 Fixed Hubble’s Blurred Vision in 1993
See how the first servicing mission restored Hubble’s focus using a new camera and corrective optics.
Read the timelineBiography context
Explore United States through connected lives
Connected biographies
Researchers and collaborators
1957–
Wendy Freedman
Observational cosmologist of the distance scaleFollow Wendy Freedman from Toronto to Carnegie and Chicago, including her work with Robert Kennicutt and Jeremy Mould on cosmic expansion.Read biography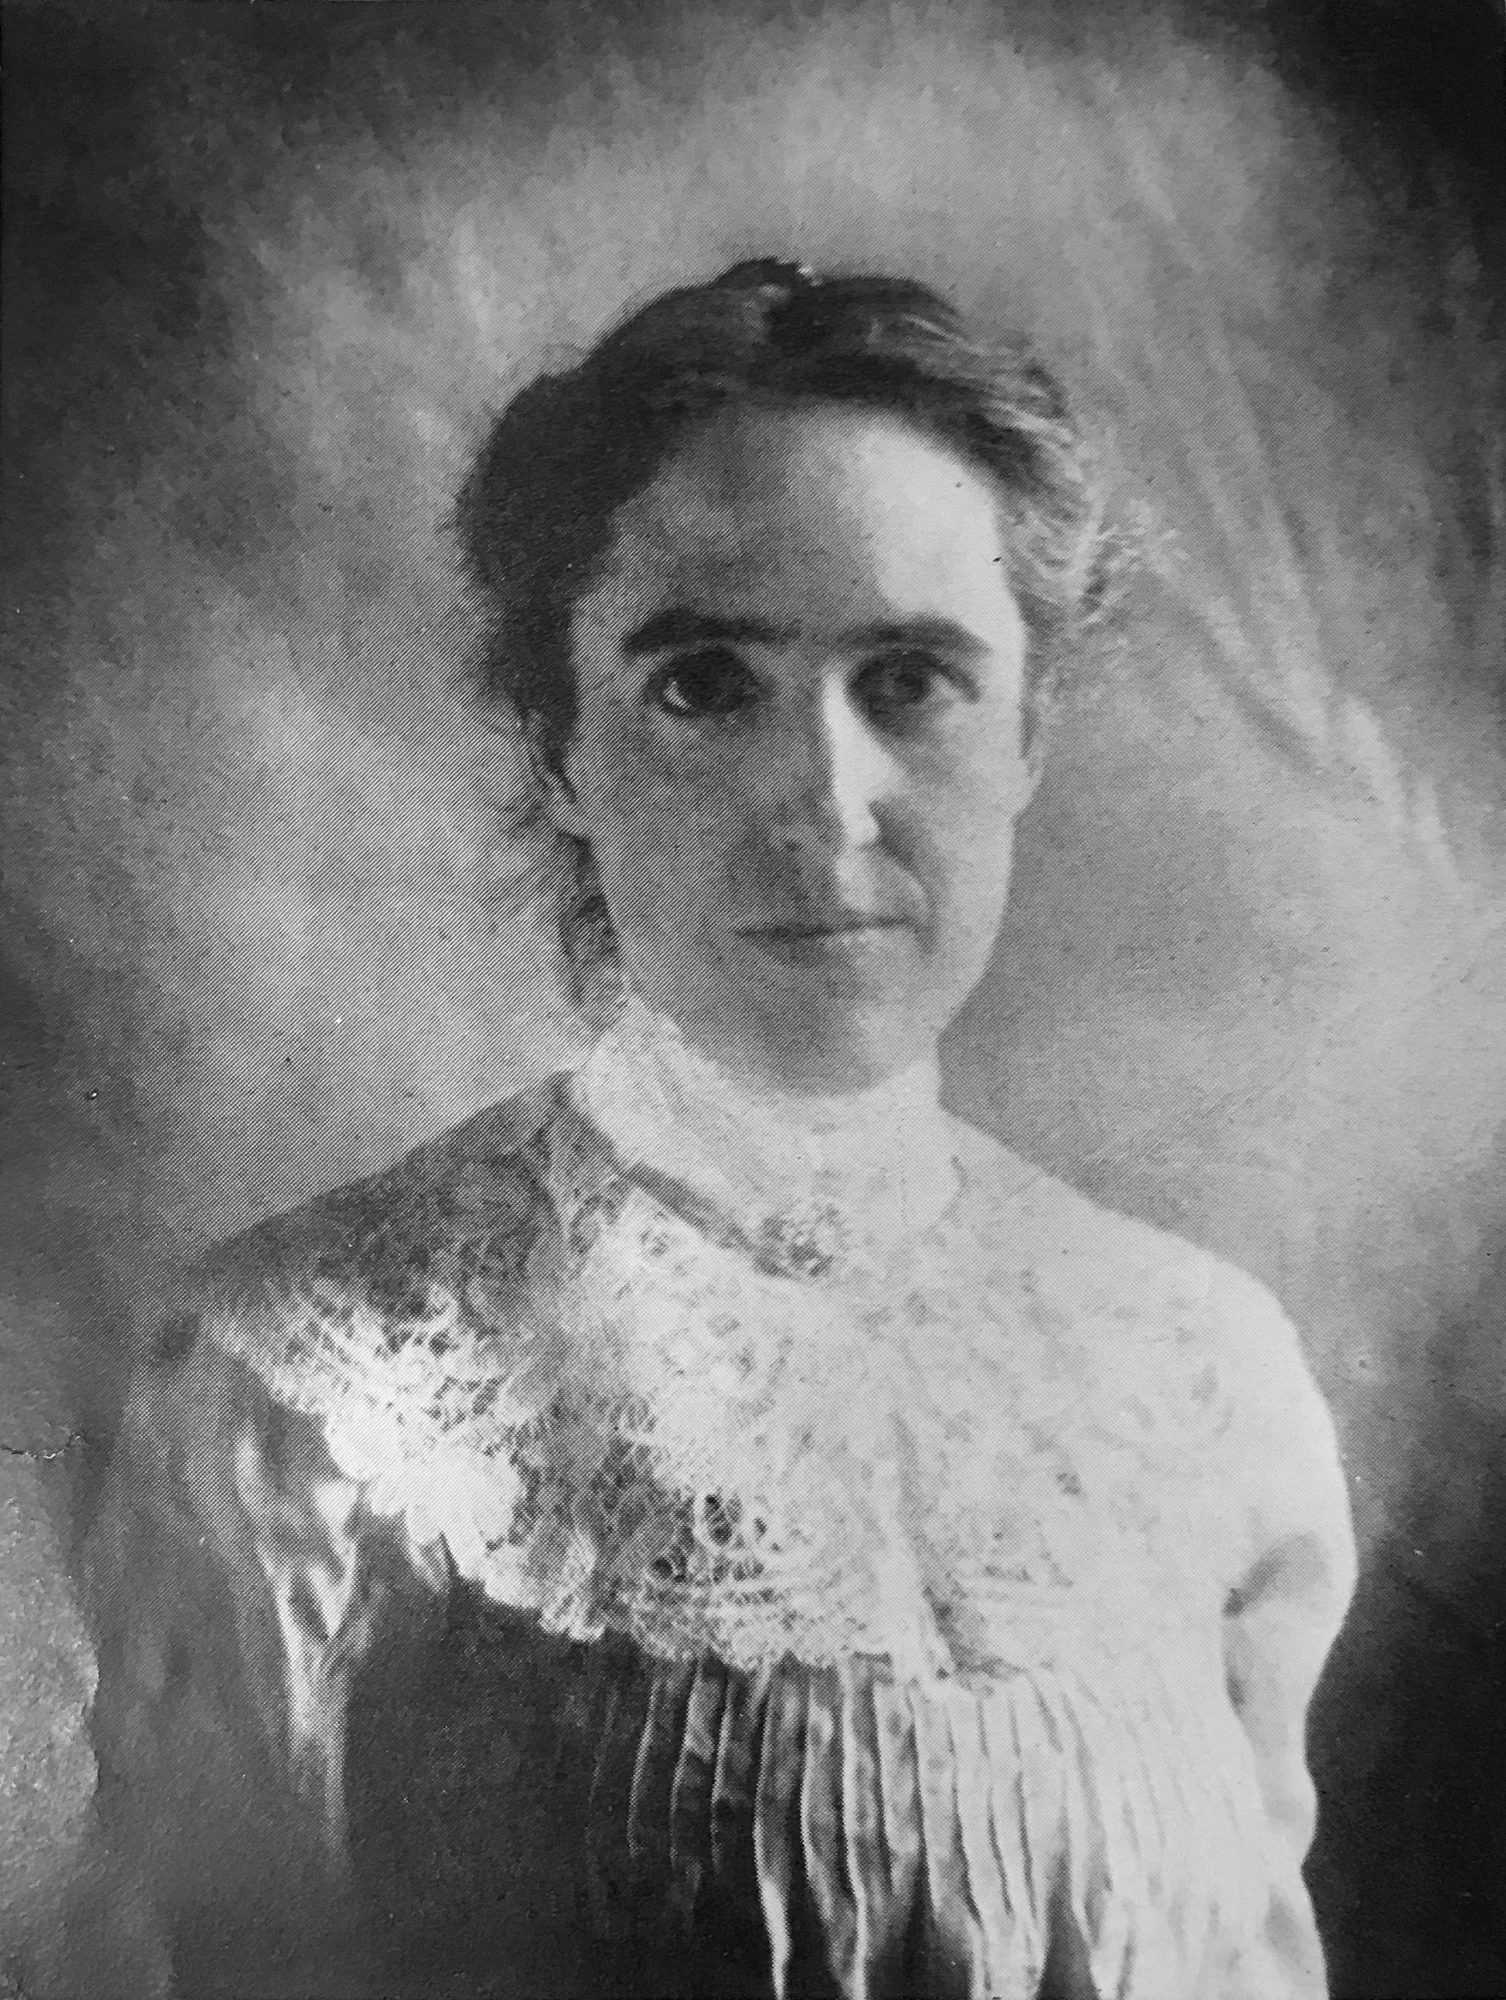
1868–1921
Henrietta Swan Leavitt
Harvard astronomer and variable-star researcherLeavitt used repeated photographs of the Magellanic Clouds to connect a variable star’s cycle with its brightness.Read biography1889–1953
Edwin Hubble
Observational astronomerEdwin Hubble used large telescopes and distance estimates to transform the study of galaxies. His work on Andromeda and the 1929 velocity–distance relation helped move cosmology toward observational tests, while depending on a wider network of measurements and calibrations.Read biographyQuick answers
Common questions
- What did the 2001 paper report?
- Its combined estimate was 72 plus or minus 8 kilometres per second per megaparsec.
- Why use several secondary methods?
- Their differing observables and measurement errors allow cross-checks while the common calibration remains visible.
Primary and institutional sources
How this history was checked
Dates, legal milestones and historical claims are checked against the official and institutional records below. This article was reviewed on 13 November 2026.