
The short answer
A protein can give an ordered diffraction pattern before researchers know where its atoms are. What further information separates those achievements?
Original source comparison
Match the evidence to the stage of research
A strong result can still be an early stage in a longer structural investigation.
| Country | What the evidence supports | What it does not establish |
|---|---|---|
| 1934 opening preview | Crystal description, condition and credited preparation. | A verified reading of the complete experimental report. |
| Ordered diffraction | Evidence that structural investigation is possible. | A direct enlarged image of every atom. |
| 1964 lecture | A participant’s later explanation of amplitude, phase and methods. | Proof that every later method was completed in 1934. |
| Toy functions A and B | Equal coefficient magnitudes can conceal a phase difference. | Actual pepsin electron density or a full three-dimensional solution. |
Chronology
A timeline of the turning points
Cambridge work
Hodgkin later recalls beginning research with Bernal.
Joint report
Bernal and Crowfoot publish the pepsin diffraction report.
Nobel lecture
Hodgkin explains structural-analysis methods in a later account.
State exactly which historical text is available
J. D. Bernal and D. Crowfoot published X-Ray Photographs of Crystalline Pepsin in Nature on 26 May 1934. The accessible opening preview and publication record were read for this guide; the full subscription paper was not acquired. Dorothy Crowfoot later became Dorothy Hodgkin. Her 1964 Nobel lecture provides a separate participant account and a general explanation of structure determination. These are different texts, written thirty years apart for different purposes. The comparison below uses the inspected opening of the earlier report and selected opening pages of the lecture. It does not claim a complete audit of the 1934 experiment.
A specimen arrived through a network of contributors
The original opening credits crystals prepared by Dr Philpot in Svedberg’s Uppsala laboratory and brought to the authors by G. Millikan. Their shape, optical properties and changes on exposure to air receive attention. This is more than background: the state of a biological crystal affects what an instrument can record. A short discovery caption should therefore preserve preparation and transfer as work, rather than make the material appear spontaneously on a famous scientist’s desk. Hodgkin’s later recollection situates the Cambridge work among discussions of liquids, natural products and biological questions. Laboratory collaboration connected those interests.
A diffraction pattern answers an ordering question first
A crystal’s repeating arrangement can produce a structured diffraction record. That establishes a useful route toward investigating internal order, but it does not make the pattern an ordinary enlarged photograph of atoms. The 1934 report’s title concerns X-ray photographs of crystals. Calling it a completed atomic structure would add a result not established by the inspected text. The distinction also protects co-authorship: Bernal’s leadership, Crowfoot’s experimental work and the suppliers’ preparation belong to a shared history. Later successful protein structures should not be written backwards as if all the necessary interpretation had already been finished in this first report.
Hodgkin explains the missing phase information
In the opening methodological discussion of her Nobel lecture, Hodgkin distinguishes measured intensities, derived amplitudes and phases used in Fourier calculations of electron density. Intensities alone do not directly supply the phases. Her discussion introduces further methods and relationships, including isomorphous replacement and heavy-atom approaches, and recognises other researchers’ contributions. This is a retrospective explanation of structural analysis, not a claim that every method was already deployed successfully on pepsin in 1934. A model needs both a way of obtaining missing information and checks against evidence. The lecture explains why recording spots and assigning atom positions are different stages.
Sources for this section: [2]
An original one-dimensional example makes the problem visible
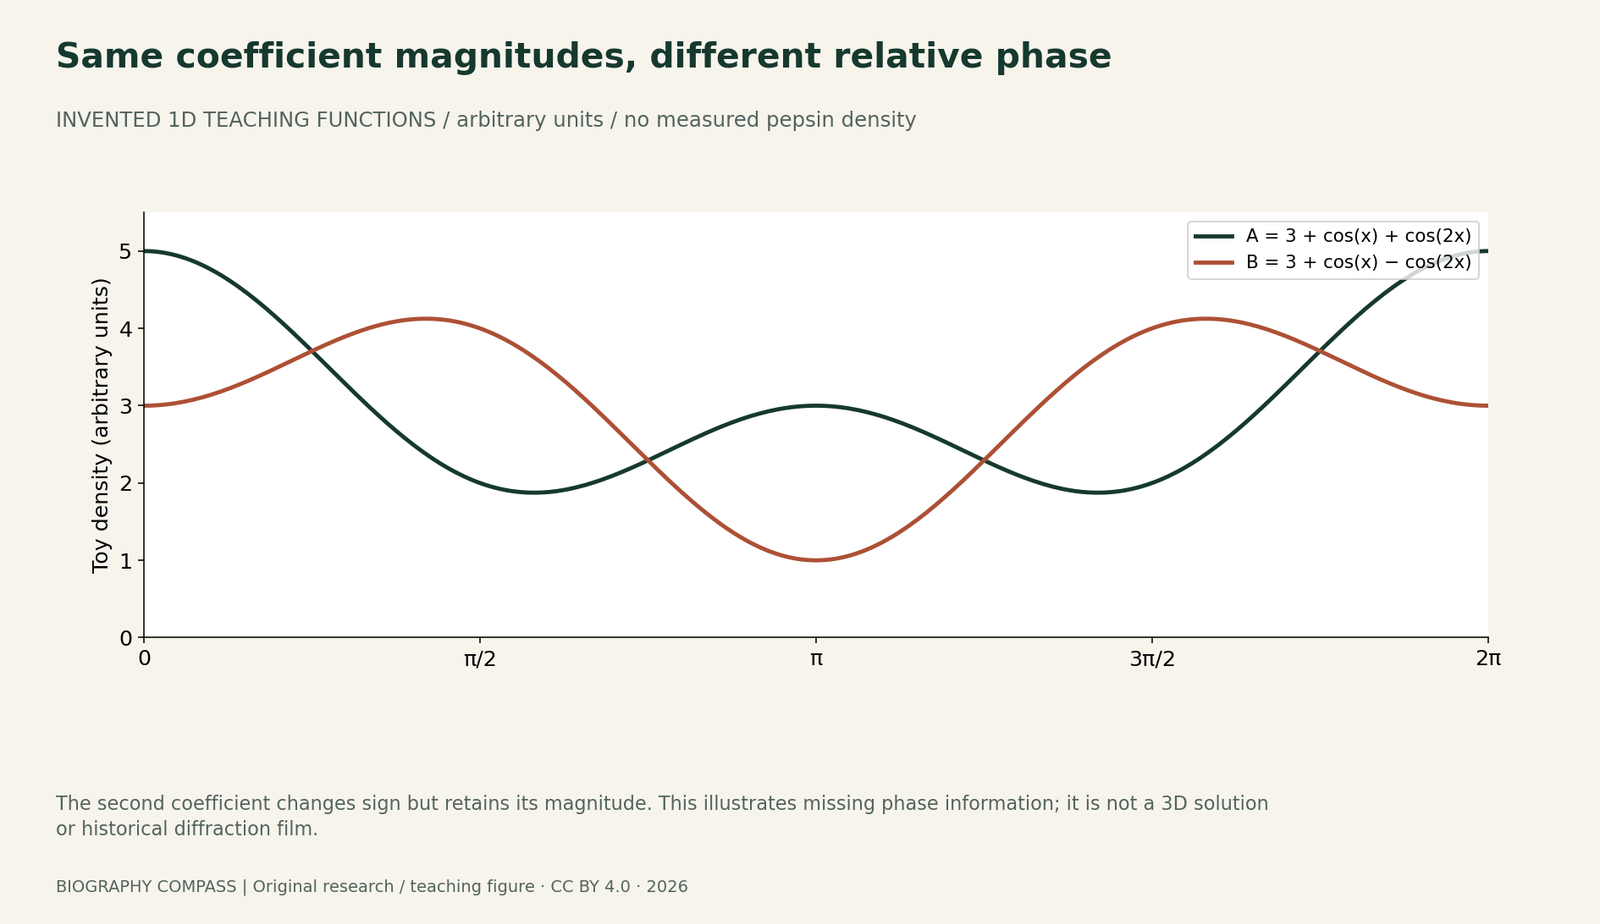
Consider two invented density functions in arbitrary units: A(x) = 3 + cos(x) + cos(2x), and B(x) = 3 + cos(x) − cos(2x). They use the same constant term and the same magnitudes for the two cosine coefficients. The sign of the second term changes its phase by half a cycle. Squaring the coefficient magnitudes therefore cannot distinguish the alternatives, yet the functions differ. At x = 0 they give 5 and 3; at x = π/2 they give 2 and 4; at x = π they give 3 and 1. Both remain nonnegative. The figure is an original mathematical teaching example, not measured pepsin density or a reconstruction of historical film.
Sources for this section: [2]
Exercise: distinguish a recorded quantity from an inferred model
Calculate the three pairs of values just listed. Then imagine that a toy instrument reports only the magnitudes 1 and 1 for the two nonconstant terms. Can that report choose between A and B? Explain which information differs. Finally classify these four statements: the experiment recorded a pattern; the specimen’s condition mattered; every atom had been positioned; one author alone performed all the work. Mark which claims the consulted texts support, which require additional evidence and which erase an identified contributor. Keep the toy functions separate from historical observations throughout the answer.
Reference answer: more measurement is not automatically the missing kind
The values are A(0)=5 and B(0)=3; A(π/2)=2 and B(π/2)=4; A(π)=3 and B(π)=1. The stated magnitude-only report cannot choose between the two functions because the relative phase of the second term is absent. This is an illustration, not a general algorithm for solving three-dimensional crystals. The original preview supports attention to crystal condition and credits a wider network. It does not justify an assertion that every atom was located or that one scientist did everything. A further historical investigation would need the full paper and relevant experimental records. The useful achievement here is a disciplined boundary between observation, mathematical inference and the record actually read.
Continue the chronology
Related history guides
Connected biographies
People behind the work
1901–1971
John Desmond Bernal
Crystallographer and writer on science and societyJohn Desmond Bernal helped extend X-ray crystallography toward biological molecules and built a research community at Birkbeck. His career joined experimental work, wartime operational research and strongly contested political commitments.Read biography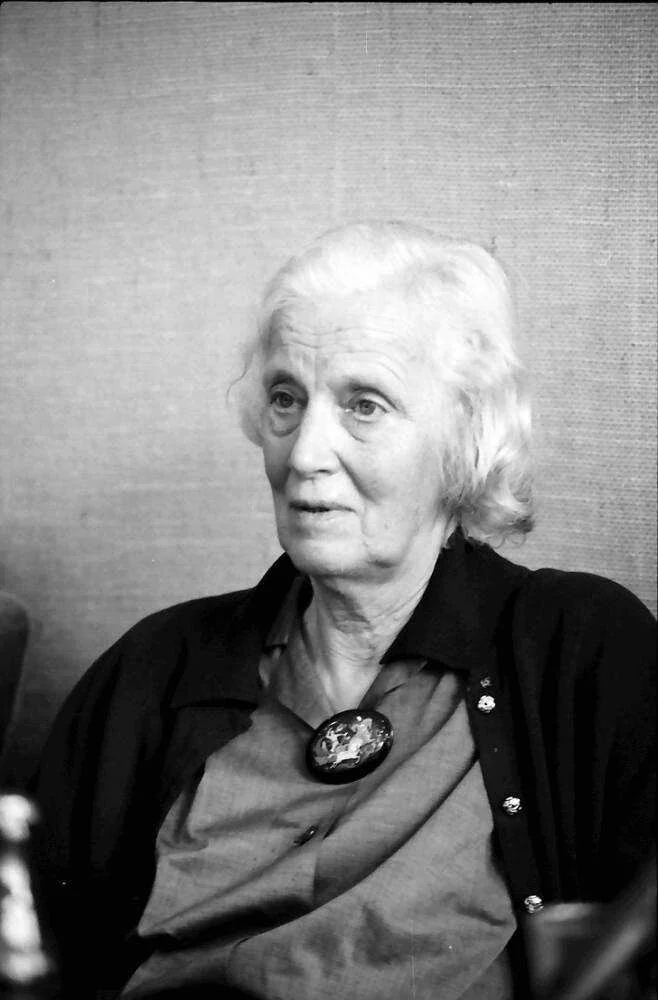
1910–1994
Dorothy Hodgkin
Chemist, crystallographer and university teacherDorothy Hodgkin used X-ray crystallography to investigate the three-dimensional structures of biologically important molecules. Her career joined experimental technique, mathematical interpretation, teaching and international research collaboration.Read biographyQuick answers
Common questions
- Is the figure a historical pepsin diffraction photograph?
- No. It plots two invented one-dimensional functions to illustrate missing relative-phase information.
- Did the guide read the entire 1934 paper?
- No. It read the accessible opening preview and metadata, plus selected pages of Hodgkin’s later lecture. That source limit is explicit.
Primary and institutional sources
How this history was checked
Compare the identified original texts, participant accounts and institutional records; the teaching examples are separately labelled. This article was reviewed on 27 October 2026.
- J. D. Bernal and D. Crowfoot; NatureX-Ray Photographs of Crystalline Pepsin, Nature 133, 794–795, 26 May 1934: opening preview
- Dorothy Crowfoot Hodgkin; Nobel FoundationThe X-ray Analysis of Complicated Molecules, Nobel Lecture, 11 December 1964
- Birkbeck, University of LondonBirkbeck crystallography: departmental history
- Birkbeck, University of LondonBernal Lecture: institutional career and commemoration