
The short answer
Two lists can have the same average while telling different stories about variation. Follow the historical question, then calculate an original example before deciding what its numbers do—and do not—establish.
Compare the quantities
Keep the claim within the model
These comparisons separate supplied assumptions, calculated results and missing evidence.
| Record or test | What follows | What remains separate |
|---|---|---|
| Dataset A | Total 16; mean 2; variance 14.75 | A historical measurement or fitted rate |
| Dataset B | Total 16; mean 2; variance 2.25 | Proof of a named probability distribution |
| Equal averages | One shared summary statistic | Identical observations or biological causes |
Chronology
A timeline of the turning points
Paper published
The source compares mechanisms and predicted variation.
Original classroom datasets
Neither list is a historical experimental table.
Report the inference boundary
A descriptive variance is not a mutation-rate estimate.
A surviving population did not settle the mechanism
The 1943 paper contrasts pre-exposure change with acquired-immunity explanations. Its footnote credits theory to Delbrück and experiments to Luria.
For the exercise below, compare the information retained by a mean with the information lost when the individual observations are discarded.
Sources for this section: [1]
Two invented lists with the same total
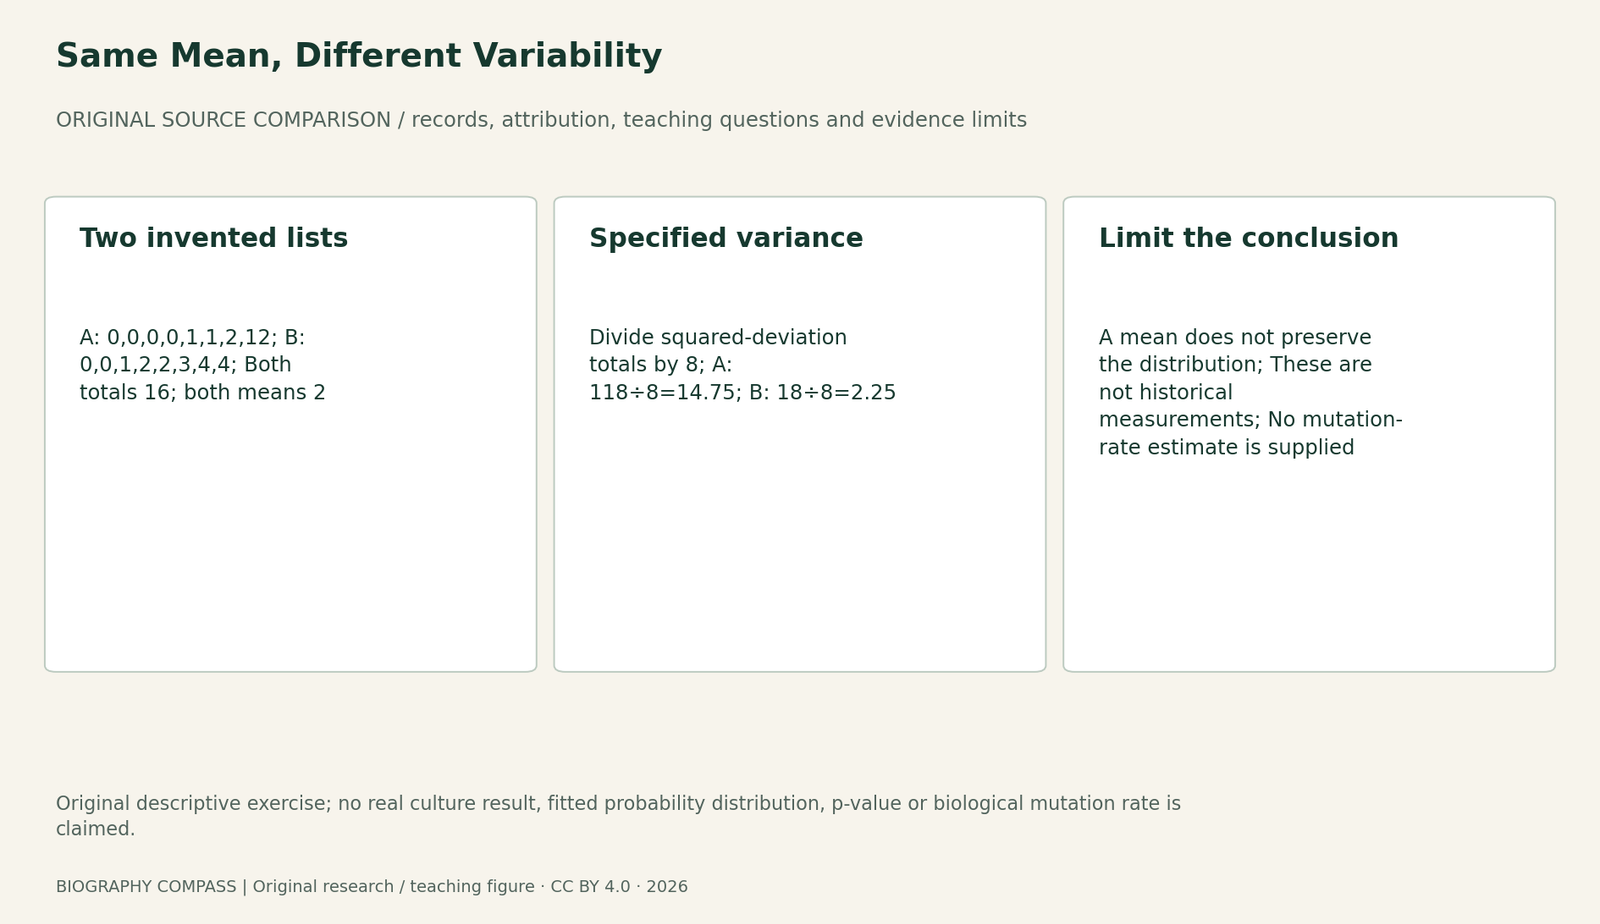
Use dataset A: [0,0,0,0,1,1,2,12] and dataset B: [0,0,1,2,2,3,4,4]. These eight-value lists are wholly invented; they do not reproduce a historical table. Each totals 16, so each mean is 16÷8=2.
An average therefore cannot distinguish these supplied lists. A report giving only the mean would hide the large value in A and the more even spread in B. Preserving individual observations is essential to the question being asked; a single summary can discard the feature that matters.
Sources for this section: [1]
Calculate the stated variance convention
Use descriptive population variance for the eight listed values:sum the squared differences from the mean, then divide by 8. In A the sum is 118, giving 14.75. In B it is 18, giving 2.25. A sample-variance calculation dividing by 7 would answer a different numerical question.
Worked answer: both means are 2, but the specified variances differ. The calculations show why equal means need not imply equal variability. They do not establish that either tiny invented list follows a particular probability distribution, and they do not yield a biological mutation rate.
Sources for this section: [1]
Connect a model to the interpretation
The paper contrasts independent pre-exposure change with random survival after exposure. The comparison concerns those models, rather than every form of genetic change.
Our toy lists illustrate the importance of retaining variation; they do not independently reproduce the historical test. To compare biological explanations, one would need justified assumptions, comparable conditions and sufficient observations. Other sources of heterogeneity could also affect a distribution, so a large descriptive variance is not a self-sufficient causal verdict.
Sources for this section: [1]
Exercise: repair an overconfident conclusion
An invented report says, “Both means are 2, so the mechanisms must be identical.” A second says, “A has the larger variance, so its exact mutation rate is now known.” Explain the separate errors without collecting or inventing more data.
Reference answer: the first discards differences in the supplied observations; the second converts a descriptive calculation into an unsupported parameter estimate. The better conclusion reports the mean, the variance convention and the limits of the inference. The historical biographies then supply the collaboration and research setting that a bare dataset cannot contain.
Continue the chronology
Related history guides
The Cori Cycle: Carbon Accounting Is Not an Energy Balance
Follow a fictional carbon ledger through the Cori cycle, compare it with the historical research record, and separate recycling, energy cost and measured flux.
Read the timelineTeaching modelPhosphorylase
Test a caption against the supplied reaction.
Read the timeline1941 paper; invented rescue modelBeadle and Tatum’s 1941 Study: Reading Nutritional Rescue
Compare the 1941 Neurospora paper with later shorthand, then solve invented rescue patterns and distinguish a pathway inference from proof of an enzyme’s identity.
Read the timelineBiography context
Explore United States through connected lives
Connected biographies
Scientists connected with this question
1912–1991
Salvador Luria
Microbiologist and scientific institution builderSalvador Luria studied bacterial viruses, helped establish microbial genetics and later combined research leadership at MIT with public political engagement.Read biography1906–1981
Max Delbrück
Physicist and molecular biologistMax Delbrück moved from theoretical physics to biology, helping make viruses and fungi experimental systems for questions about heredity and response.Read biographyQuick answers
Common questions
- Were the two eight-value lists used in 1943?
- No. They are invented teaching data.
- Can their variance reveal a mutation rate?
- No. The exercise supplies neither an appropriate fitted model nor the biological information required.
Primary and institutional sources
How this history was checked
Read the specified original or institutional records alongside the explicitly invented teaching model; their different evidential roles are stated in the text. This article was reviewed on 29 October 2026.