
The short answer
An economic plan can be precise without describing an accomplished result. Before comparing its percentages, establish what each number divides and whether it refers to a base year or a target.
Compare the records
Match each conclusion to its evidence
Preserve the document’s date, author and object.
| Record | Supported reading | Unwarranted inference |
|---|---|---|
| Later planning text | Reported base and projected export share. | A verified endpoint or causal effect. |
| Earlier-plan overview | Separate manufacturing and manufactured-export ratios. | One interchangeable percentage series. |
Chronology
A timeline of the turning points
Earlier plan approved
Its ratios need their own denominator labels.
Start with the document’s verb
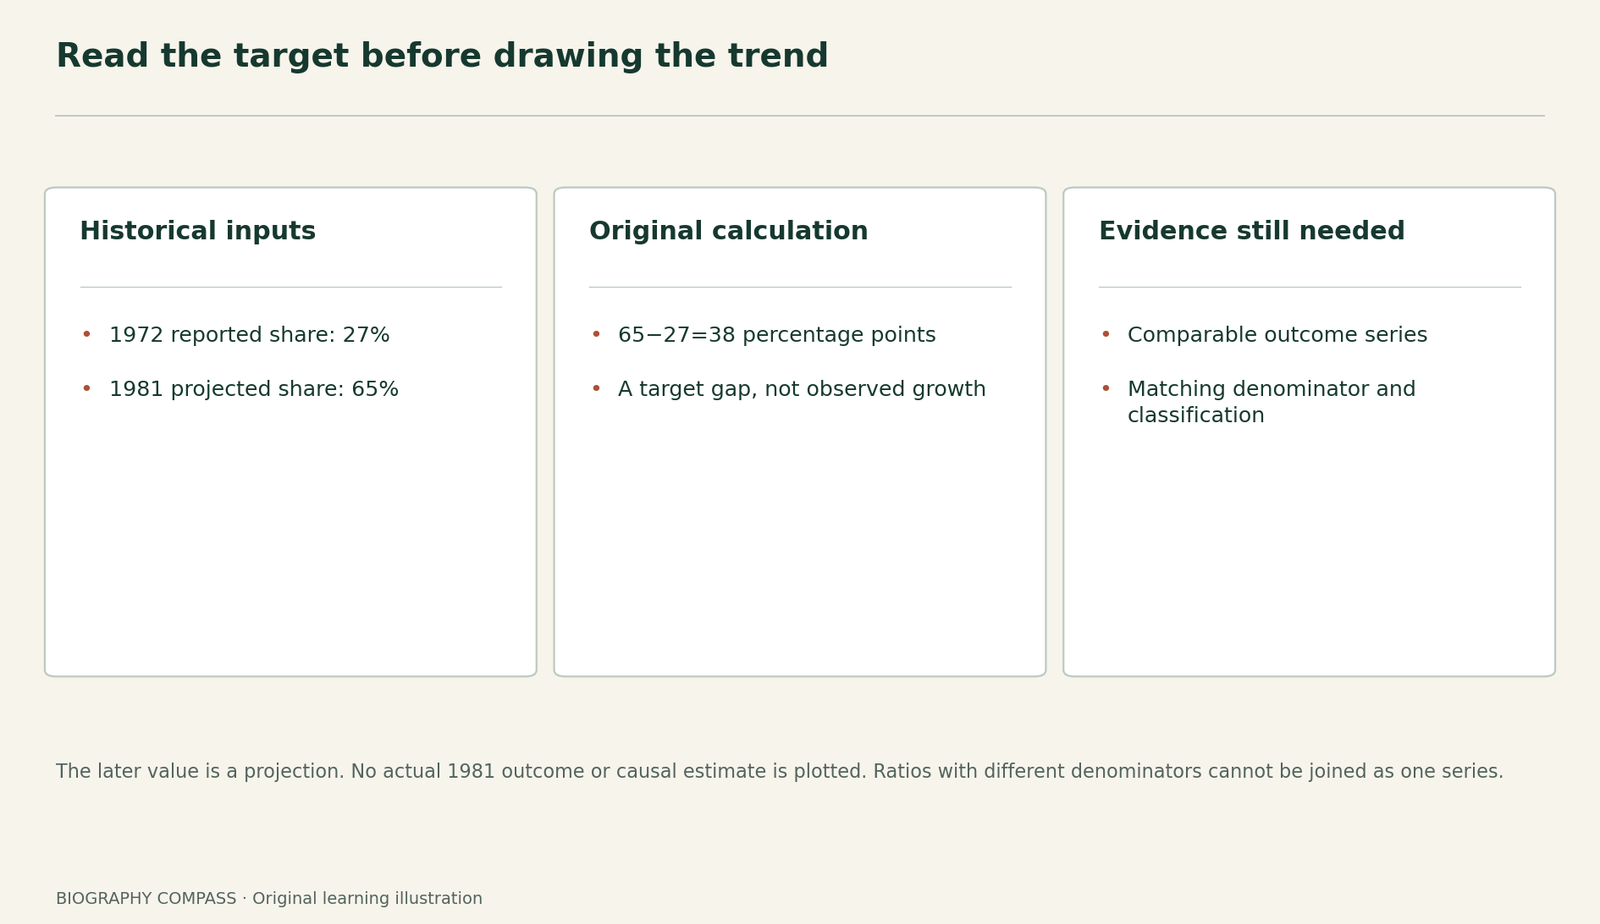
The Economic Planning Board’s December 1973 text reports heavy and chemical products at 27% of exports in 1972 and projects 65% in 1981. It envisages private initiative supported by government finance, industrial sites and technical workers.
The two percentages occupy different evidential positions: a reported starting observation and a future objective. Placing both on a line labelled “actual performance” would silently turn a policy intention into a statistical result. The exact-looking endpoint is no protection against that error.
Sources for this section: [1]
An earlier plan has a different denominator
The National Archives overview describes the 1972–76 Third Five-Year Plan, approved in 1971. It gives planned heavy-and-chemical shares of manufactured exports rising from 14% to 33%, and separate shares of manufacturing rising from 35.9% to 40.5%.
Those are two different ratios even within the same overview. Neither should be spliced automatically onto a later series that says simply exports. A defensible comparison needs the original classification and denominator, as well as the year. A larger percentage may reflect a different population rather than a stronger outcome.
Sources for this section: [2]
Industrialisation required institutions
The later plan names specialised industrial bases and six broad industries: steel, nonferrous metals, shipbuilding, machinery, electronics and chemicals.
The earlier-plan overview describes wider ministerial participation and links industrial expansion to technical education and research.
Nam Duck-woo later headed the Economic Planning Board.
This places the policy in an administrative and productive system. A minister’s later appointment does not make him the author of every earlier planning sentence, and listing a proposed site does not prove that its facilities were completed. The texts illuminate how officials expected transformation to occur; separate completion and output records would be needed to assess execution.
Worksheet: repair a misleading chart
Invented catalogue note: “This chart proves that the policy raised the share from 27% to 65%.” Diagnose two errors, then rewrite it. Calculate the difference in percentage points and explain whether that calculation supplies the missing historical evidence.
Reference answer: the note substitutes a projected endpoint for an observed result and asserts causation without an evaluation. A defensible label is “reported base-year share and planned endpoint”. The difference is 65−27=38 percentage points. That arithmetic describes the gap between two stated numbers; it does not demonstrate that the later target was reached. Before drawing a performance graph, obtain a comparable outcome series and document its coverage.
Sources for this section: [1]
What to record in your research notes
Use separate columns for document date, reference year, denominator, observed/projected status and implementing institution. Leave the outcome cell empty when the selected record does not supply it. This is more informative than filling the cell with the target or assuming that a later publication converts a forecast into an observation.
Continue the chronology
Related history guides
Biography context
Explore South Korea through connected lives
Connected biographies
People and institutions
1924–2013
Nam Duck-woo
Former prime ministerNam linked economic administration with Pacific cooperation.Read biographyQuick answers
Common questions
- Does calculating the gap establish success?
- No. A subtraction cannot supply an unobserved outcome or establish a policy’s causal effect.
Primary and institutional sources
How this history was checked
Read the selected records alongside the comparison, then test what each document can establish. This article was reviewed on 30 October 2026.