
The short answer
Removing a fee can open a school gate quickly. Supplying books, managing larger classes and keeping children attending require a continuing programme. Kenya’s 2003 rollout offers records for examining all of those stages.
Original comparison
Four claims require four kinds of evidence
Fee policy, school registers, daily presence and achievement answer different questions.
| Country | What it records | What it cannot establish alone |
|---|---|---|
| Fee removal | A change in charges and programme commitments | Every household education cost disappeared |
| Enrolment | Pupils registered in a defined population and year | Regular attendance or a causal learning gain |
| Attendance | Presence on observed school days | Grade-level mastery |
| Learning | Achievement measured with a suitable assessment | The cause of change without a defensible comparison |
Chronology
A timeline of the turning points
New government
Kibaki’s coalition entered office with an education commitment.
Fee removal and urgent coordination
The ministry convened implementers and set up a task force.
Support project appraisal
World Bank documented financing, materials and management needs.
School assessment
UNESCO and ministry-linked researchers visited nine sampled districts.
Assessment published
School data and participant accounts showed achievements and implementation pressures.
A presidential commitment became a ministry programme
Mwai Kibaki’s incoming government introduced free primary education at the start of 2003, removing school fees and levies at primary level. The implementation record involves much more than a presidential announcement. UNESCO’s assessment describes an urgent January meeting convened by the education minister, attended by officials, civil society, faith groups and private-sector representatives. A task force and district visits followed. Teachers and headteachers had to translate a rapid national commitment into admissions, timetables and classrooms. The early coordination difficulties are part of the policy’s history, alongside the opening of access that families had demanded.
Finance had to replace charges and supply materials
The May 2003 World Bank appraisal proposed a US$50 million grant for the Free Primary Education Support Project. Its priority was instructional materials together with training and institutional capacity. The programme built on earlier school-based textbook work supported by other partners. The appraisal also identified financial-management weaknesses and planned accounting support, audits, monitoring and public information. Those are design provisions, not evidence that every shilling was subsequently spent correctly. School committees, ministry staff and funding agencies shared implementation responsibilities. Political credit for fee removal should therefore be assessed alongside the practical system needed to transfer resources and make spending visible.
Sources for this section: [1]
Enrolment estimates indicate access, with limits
The contemporary appraisal reported a Ministry estimate of about 7.2 million primary pupils, nearly one million above 2002; the associated sector review used approximately 6.3 million for the preceding year. These are rounded early estimates. They should not be silently combined with later administrative totals that use different coverage or revisions. Enrolment counts registrations, attendance records whether pupils are present, and learning requires evidence of what they understand and can do. A gross enrolment ratio can exceed 100 per cent because its numerator includes pupils outside the official primary-school age range. None of these measures is interchangeable with a learning gain.
The school assessment found growth and subsequent attrition
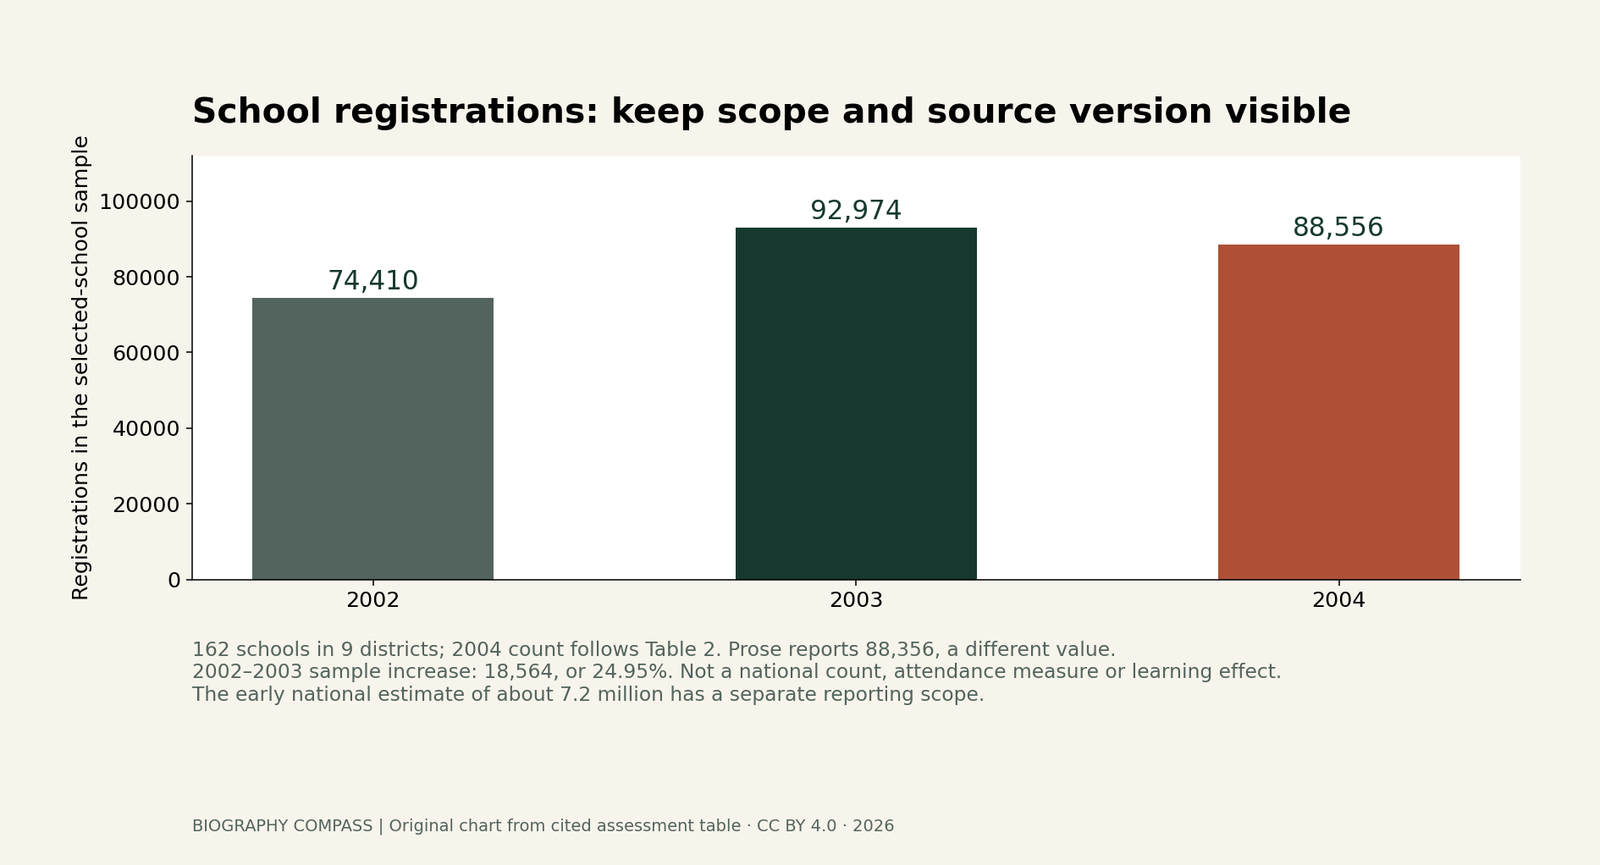
UNESCO’s March 2005 assessment reports fieldwork in 162 primary schools across nine districts in February 2004, using school data, interviews, observation and focus groups. Its sample totals are 74,410 pupils in 2002 and 92,974 in 2003. For 2004, the executive summary reports 88,356, while Table 2 prints 88,556; adding its nine district figures reproduces the table total. The figure here uses that table value and flags the disagreement. Neither version is a national census. Transfers and dropout are different explanations for falling registration; the sample does not by itself establish either contribution.
Sources for this section: [3]
Free schooling did not mean every cost disappeared
The school assessment records confusion among parents and teachers about what government would supply. Uniforms, facilities and household obligations remained points of disagreement. It also describes delayed grants, congested classrooms, inadequate desks and demanding textbook procurement procedures. The sector review treats household expenditure as broader than tuition alone, including uniforms, transport, meals and other items. These records prevent a misleading claim that eliminating fees removed every barrier. The assessment contains participant views about quality and classroom observations; these should not be relabelled as a causal test proving that the policy raised or lowered national learning achievement. A headteacher’s report of congestion can establish a practical concern in that school. It cannot, without appropriate assessment and comparison, supply a national estimate of how much achievement changed because fees were removed.
Worked exercise: calculate growth without overstating success
Using the consistent 2002 and 2003 sample totals, the increase was 92,974 minus 74,410, or 18,564 registrations. Dividing by 74,410 gives about 24.95 per cent. That is growth within the sample, not the percentage of all Kenyan children newly attending school. The reference answer should disclose the denominator and source population before interpreting the figure. To evaluate durable access and learning, request comparable attendance, retention, progression and achievement evidence in addition to enrolment. An increase can contain first-time entrants, returning pupils and transfers; registrations alone cannot tell how many children moved from being entirely out of school to regular participation.
Continue the chronology
Related history guides
Connected biographies
People connected with this policy
1931–2022
Mwai Kibaki
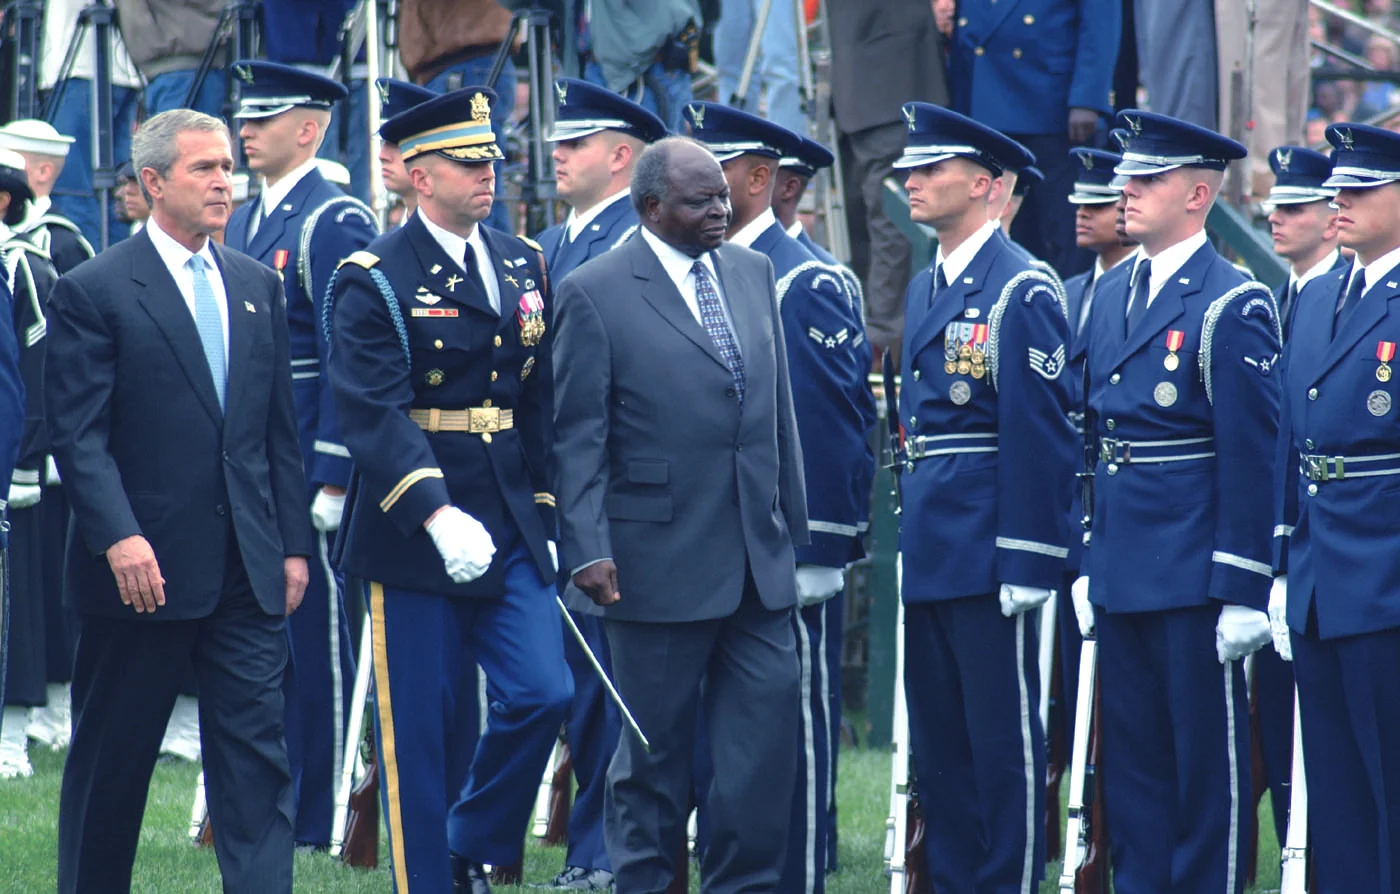
Economist, finance minister and Kenya’s third presidentMwai Kibaki moved from university economics into KANU, Cabinet and opposition politics before winning the presidency in 2002. His administration expanded primary education and later governed through a coalition after the disputed 2007 election.Read biographyQuick answers
Common questions
- Were all primary education costs abolished?
- The policy removed fees and levies, while households still faced other costs and implementation disputes.
- Was the UNESCO sample a national census?
- No. It covered 162 schools in nine sampled districts.
- Why is the percentage labelled a sample increase?
- It uses registrations in the selected 162 schools. Its denominator is their 2002 enrolment, not Kenya’s school-age population.
Primary and institutional sources
How this history was checked
Original records anchor the chronology and policy explanation. The comparison, calculation and evidence exercise are original reader aids; the source notes explain limits. This article was reviewed on 27 October 2026.
- World Bank / Government of Kenya programmeKenya Free Primary Education Support Project, Project Appraisal Document 25651-KE, 23 May 2003
- World Bank with Ministry of Education, Science and Technology technical working groupStrengthening the Foundation of Education and Training in Kenya: Opportunities and Challenges in Primary and General Secondary Education, Report 28064-KE
- UNESCO Nairobi Office with Kenya Ministry of Education, Science and Technology; Parliament of Kenya LibraryChallenges of Implementing Free Primary Education in Kenya: Assessment Report, March 2005
- Kenya Presidential Library and ArchivingHE Emilio Mwai Kibaki: institutional biography