
The short answer
A sample can contain many small particles yet have most of its material in a few larger ones. The original report motivates careful size characterisation; the invented mixture below makes a separate weighting problem visible.
Read the evidence
The denominator determines the share
Separate the record’s objects and observations from the conclusion being tested.
| Item | What is being compared | Limit |
|---|---|---|
| Count share | 10/100=10% | Every sphere receives equal weight |
| Volume share | 80000/170000=47.06% | Equal-density spheres; invented diameters |
| Weighted diameter | 11 nm versus 14.71 nm | Different weighting rules, same population |
Chronology
A timeline of the turning points
Synthesis and characterisation
The report treats output and particle characterisation separately.
Change the weights
The same fictional population supports different averages.
Scale and uniformity were separate claims
Park and colleagues reported forty grams of nanocrystals from a single reaction without size sorting. Their selected characterisation passage describes a 12 nm sample with 2.3% size variation. Output mass and the spread of particle sizes are separate quantities.
A photograph of a large batch would not by itself establish its size distribution. Conversely, a selected field of uniform-looking particles would not establish the amount produced. The claims need measurements directed at each question.
Sources for this section: [1]
Several measurements addressed different properties
The paper’s selected pages combine TEM, x-ray diffraction, x-ray absorption and magnetic circular dichroism. The authors use these to investigate particle size, structure and composition. Their reported nucleation-and-growth explanation draws on more than an image alone.
This comparison helps keep the historical claim precise: there was an effort to characterise a material, not simply to give it one flattering size label. The guide does not reproduce a micrograph, derive an uninspected histogram or prescribe a synthesis procedure.
Sources for this section: [1]
An original mixture with explicit geometry
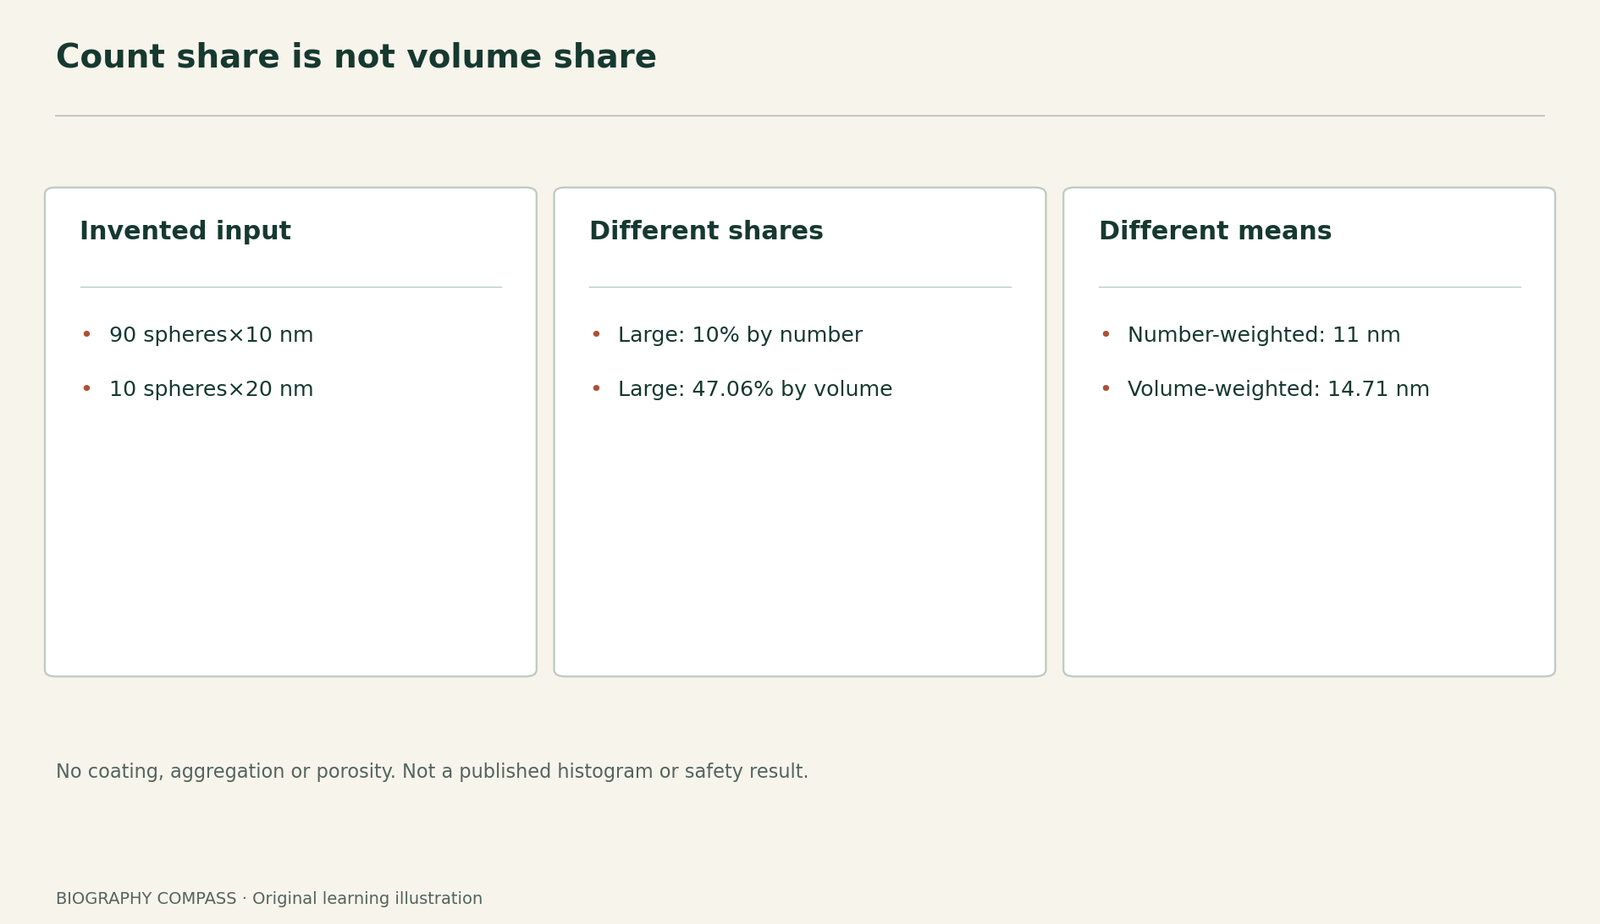
Invent a mixture of ninety spheres with diameter 10 nm and ten spheres with diameter 20 nm. Assume every sphere has the same density, with no coating, aggregation or porosity. Treat volume as proportional to diameter cubed; the common factor cancels in shares. What percentage of particles are large? What percentage of total particle volume belongs to them? Calculate the number-weighted mean diameter.
Then compute the volume-weighted mean diameter, meaning sum(volume×diameter)/sum(volume). Do not call it a directly measured average or confuse it with the diameter of a sphere having the average particle volume.
Sources for this section: [1]
Reference answer and limits
Large particles are 10% by number. The relative volumes are 90×10³=90000 and 10×20³=80000, in common cubic-nanometre proportional units. Their volume share is 80000/170000=47.06%. The number-weighted diameter is (90×10+10×20)/100=11 nm.
The volume-weighted diameter is (90000×10+80000×20)/170000=14.71 nm. Equal density makes the volume shares also mass shares in this fictional model. The different answers are compatible: they apply different weights to the same invented particles. None is the paper’s observed distribution or an application-specific safety assessment.
Sources for this section: [1]
Continue the chronology
Related history guides
Drosha–DGCR8: What Did Add-Back Show?
Compare another selected research record and an explicitly bounded learning example.
Read the timeline2009 record and an original learning exerciseZeolite Nanosheets: What Does 2 nm Measure?
Compare another selected research record and an explicitly bounded learning example.
Read the timelineBiography context
Explore Worldwide through connected lives
Connected biographies
Researchers connected with these records

Born 1964
Taeghwan Hyeon
Nanomaterials chemistTaeghwan Hyeon develops ways to make and characterise nanocrystals.Read biographyQuick answers
Common questions
- Is the invented mixture a reproduction of the reported sample?
- No. Its particle counts and diameters were chosen to make the weighting calculation transparent.
Primary and institutional sources
How this history was checked
Only selected article text was read. The teaching mixture was created for this guide and is not the paper’s measured distribution. This article was reviewed on 30 October 2026.