
The short answer
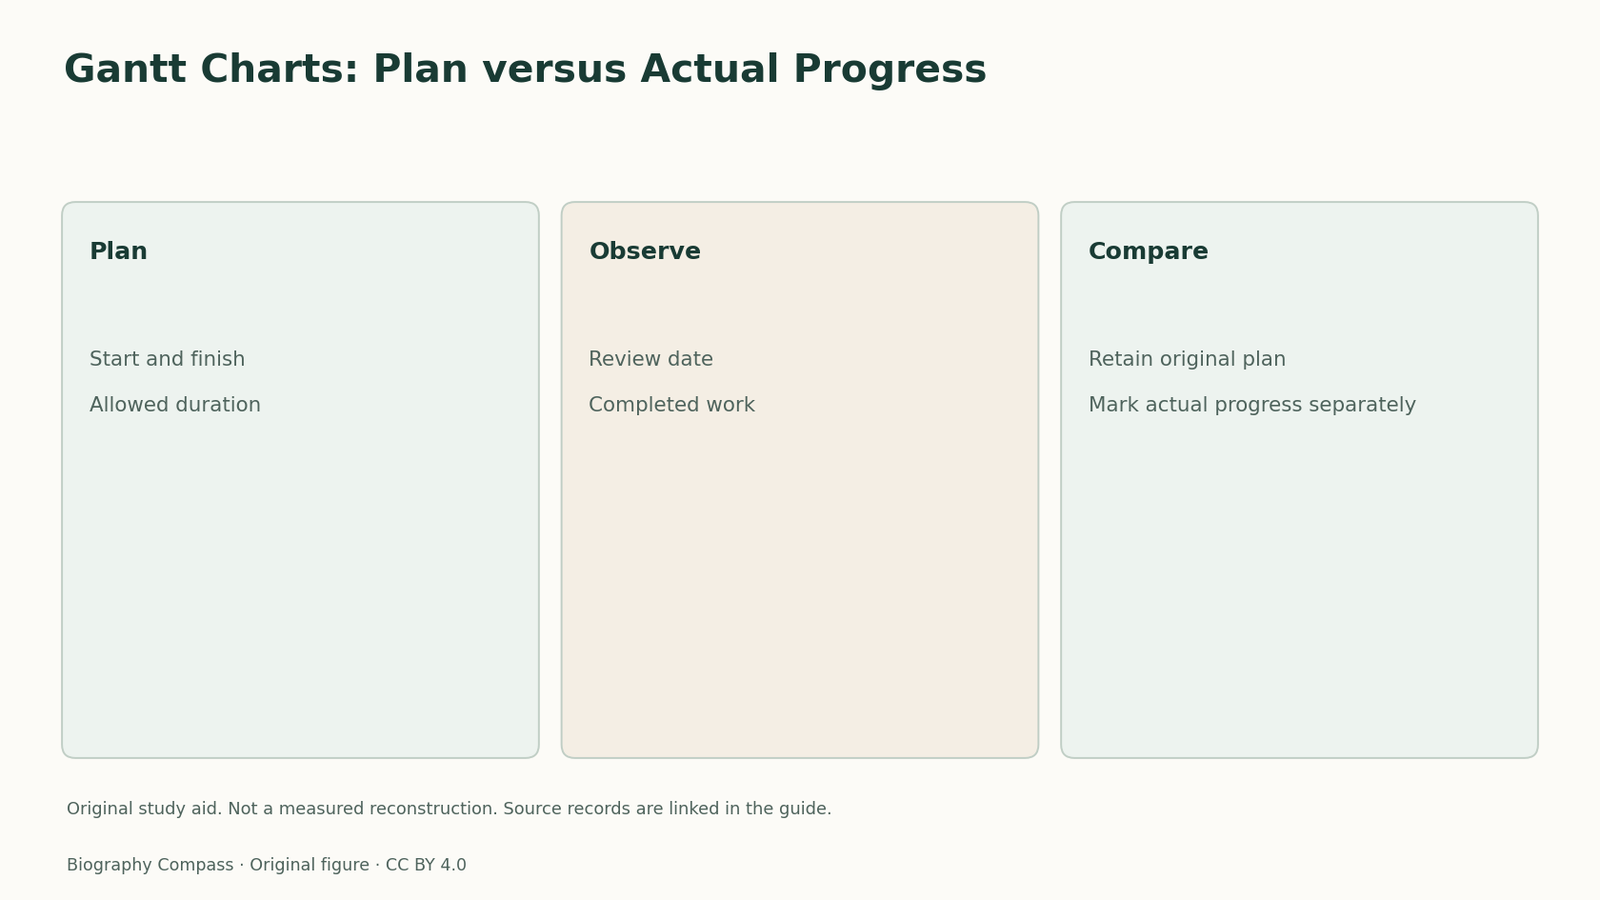
How does a Gantt chart distinguish planned work from actual progress?
Compare the evidence
Observation, method and result
Compare the inspected records and the different claims they support.
| Record | Evidence | Limit |
|---|---|---|
| Stevens archive | Early 1903 chart and a historical management career. | Does not date every later software convention. |
| ASME project guide | Distinguishes schedule information and progress review. | Modern teaching guidance is not an original 1903 chart. |
A schedule answers more than an end-date list
ASME’s project-management guide distinguishes a list of completion dates from a bar chart that also makes start dates and duration visible. This matters when two activities occupy the same period. Knowing their finishing dates alone does not show when either must begin or how much time has been allowed. A horizontal time scale gives the activities a common frame. The placement and length of a planned bar communicate a schedule; they do not prove that the work has actually occurred.
Sources for this section: [3]
Record progress as a separate layer
Consider an invented teaching example: research is scheduled for four days and drawing for two days. At a review after the second day, only one day’s research output has been completed. Keep the planned four-day bar in place and mark the completed portion separately. The difference makes slippage visible instead of rewriting the original plan to hide it. No historical Gantt project supplied these numbers. They demonstrate the distinction between time allocated, time elapsed and work completed.
Sources for this section: [3]
Do not assign every modern feature to one inventor
Stevens documents an early chart at the American Locomotive Company in 1903 and the later popularisation of Gantt’s methods. ASME’s guide describes contemporary project practice, including relationships and review points. These sources serve different purposes. A strong answer uses the historical record to explain Gantt’s contribution and the modern guide to explain a present-day exercise. It should not infer that every dependency arrow or software control was present in the earliest chart simply because the interface now carries his name.
Continue the chronology
Related history guides
Biography context
Explore United States through connected lives
Connected biographies
People behind the records
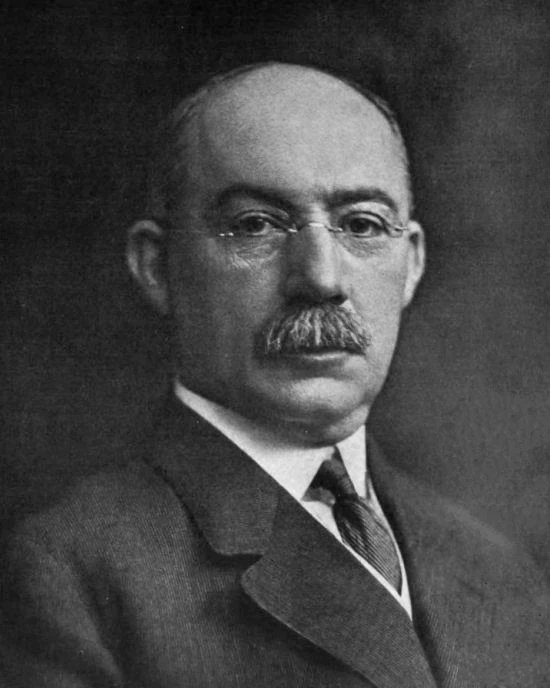
1861–1919
Henry Gantt
Mechanical engineer and management consultantHenry Gantt developed management charts and task-and-bonus methods that connected production planning with attention to the people doing the work.Read biography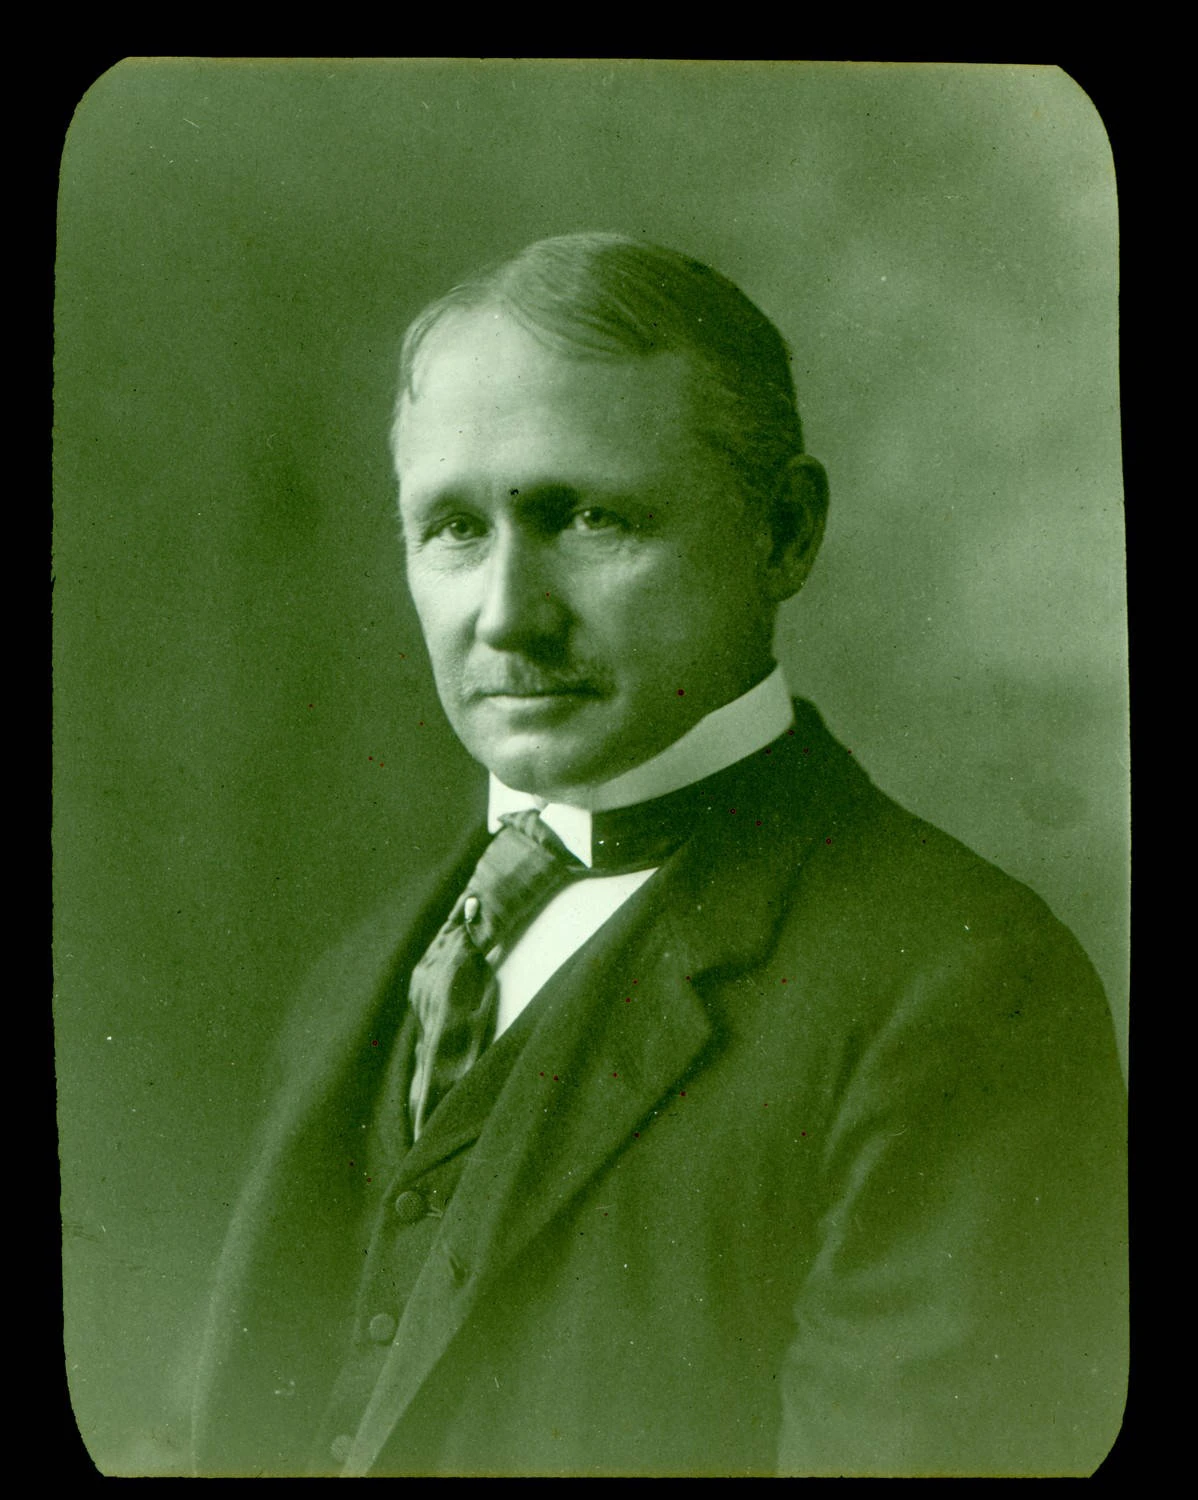
1856–1915
Frederick Winslow Taylor
Mechanical engineer and management consultantFrederick Winslow Taylor combined metal-cutting research with a controversial programme for measuring and organising industrial work.Read biographyQuick answers
Common questions
- How does a Gantt chart distinguish planned work from actual progress?
- A planned bar shows allocated time. Actual progress needs a separate record of completed work at a stated review date; elapsed time is not the same as completion.
Primary and institutional sources
How this history was checked
Source notes distinguish documented facts from the explanatory examples and diagrams created for this guide. This article was reviewed on 7 November 2026.