
The short answer
What did the 2010 CAPRISA 004 paper mean by a 39% reduction, and why is that different from a percentage-point change in cumulative risk?
Read the evidence
What each observation can establish
Keep the measured quantity separate from the inference.
| Record or exercise | What is observed | What follows | Limit |
|---|---|---|---|
| 2010 event counts | 38 / 60 infections | Events within analysed groups | Counts alone omit follow-up time. |
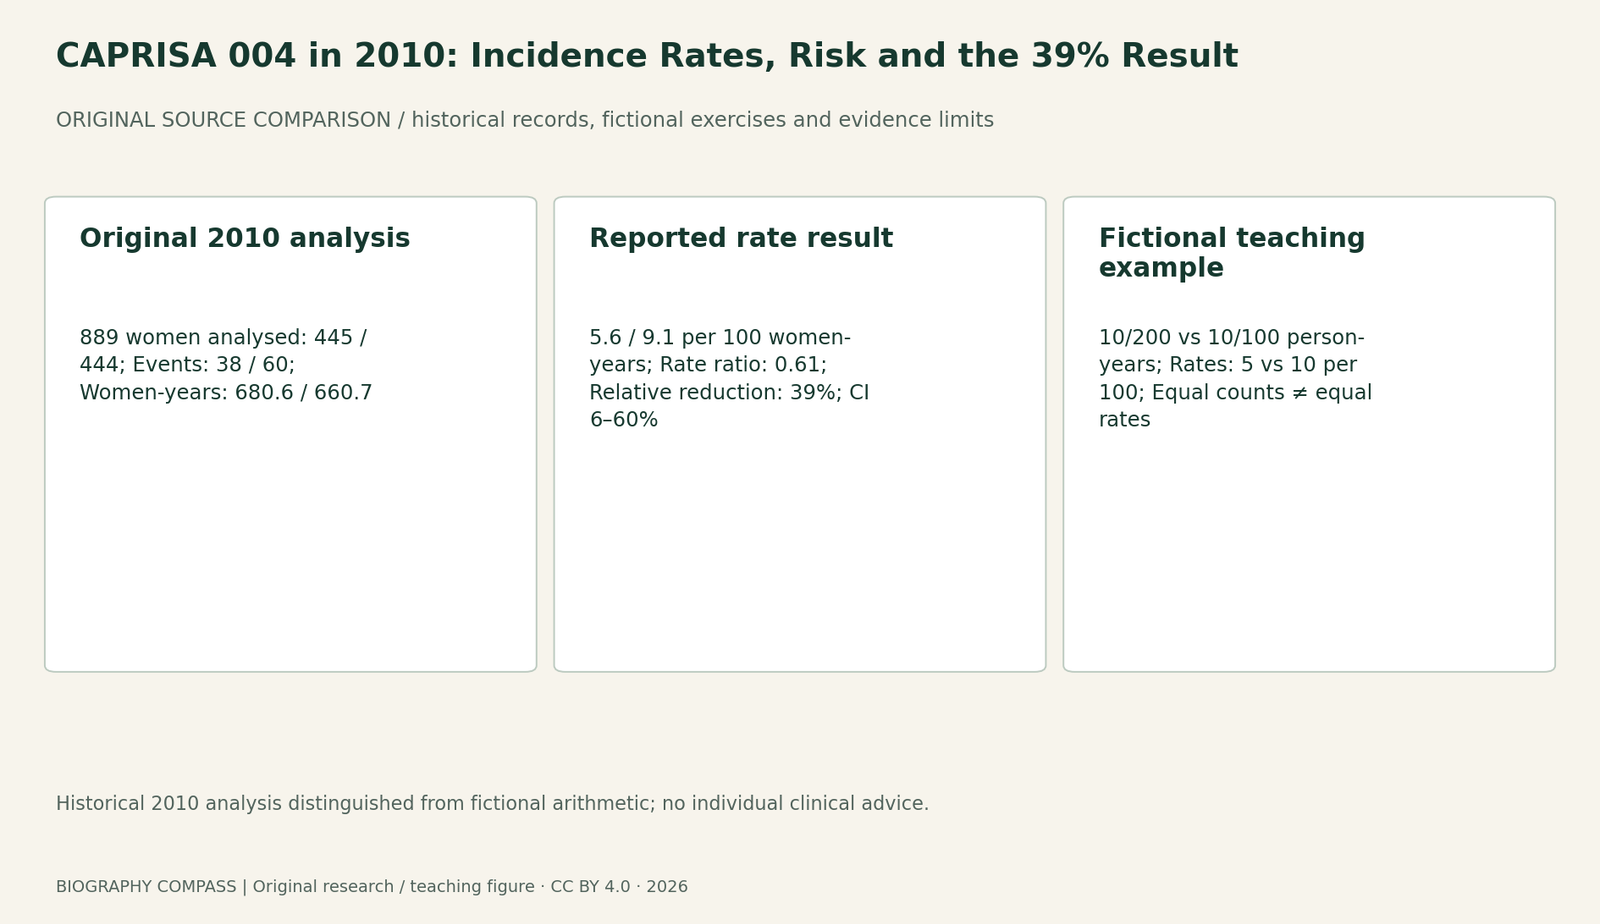
| 2010 incidence rates | 5.6 / 9.1 per 100 women-years | Reported rate ratio 0.61; reduction 39% | Not a 39-percentage-point risk difference. |
| Fictional equal counts | 10/200 and 10/100 person-years | 5 vs 10 per 100 person-years | Arithmetic alone does not prove causality. |
Chronology
A timeline of the turning points
Records in context
Historical 2010 analysis distinguished from fictional arithmetic; no individual clinical advice.
Read the analysis population and its denominators
The original 2010 report’s analysis included 889 women: 445 in the tenofovir-gel group and 444 in the placebo group. Table 2 records 38 versus 60 infections over 680.6 versus 660.7 women-years. The paper also discusses earlier enrolment; 889 should not be relabelled as every woman initially enrolled.
Dividing events by person-time gives about 5.6 and 9.1 infections per 100 women-years, the rounded rates reported in the paper. Person-time allows follow-up duration to enter the denominator. It is not the same denominator as the number of women in a group.
Sources for this section: [1]
Relative rate reduction is not percentage points
The reported incidence-rate ratio was 0.61, so 1 − 0.61 gives a 39% relative reduction in rate. The paper reported a 95% confidence interval for effectiveness of 6% to 60%. The point estimate is therefore not a guaranteed effect for each participant, much less for all women in other settings.
For comparison, raw event proportions are 38/445, about 8.54%, and 60/444, about 13.51%. These are different quantities from person-time rates. Their difference is about 4.97 percentage points in this analysed dataset; it is not 39 percentage points and is not a fixed-time risk estimate that can simply be generalised.
Sources for this section: [1]
An original person-time exercise
Imagine two fictional groups with 10 events each. Group A contributes 200 person-years and group B contributes 100. Question 1: calculate their rates per 100 person-years. Answer: A is 5 and B is 10. Equal event counts need not mean equal rates when follow-up differs.
Question 2: what is the rate ratio A/B and the relative rate reduction? Answer: 5/10 = 0.5, giving 50%. Question 3: does this arithmetic establish a causal treatment benefit? Answer: no. The fictional exercise supplies no randomisation, uncertainty estimate or information about comparable populations.
Sources for this section: [1]
What the trial result does not settle
The 2010 report discusses adherence and differences between study settings. Adherence categories were not separately randomised treatment assignments, and the study was not designed to estimate each site’s effect reliably in isolation. A subgroup number is not automatically an independently established causal result.
Quarraisha Abdool Karim’s principal-investigator role sits within a wider author, staff and participant contribution. This guide concerns interpretation of a historical trial. It supplies no regimen, prescribing recommendation or claim about current product approval; those require current clinical evidence and authorities.
Continue the chronology
Related history guides
Brenner’s Worm Genetics: Why 300 Mutants Were Not 300 Genes
Read Brenner’s 1974 mutant and gene counts alongside his later accounts, then practise distinguishing isolates, groups and genome claims with worked answers.
Read the timeline1982Klug, Tobacco Mosaic Virus and the Limits of a Structural Map
Use Aaron Klug’s 1982 lecture to distinguish a virus structure from its assembly pathway, read an aggregate boundary and practise evidence limits.
Read the timeline1956–1979Cormack’s Tomography Problem: Measurement Is Not Reconstruction
Explore Allan Cormack’s original tomography problem, distinguish attenuation from an interior image and solve a two-by-two reconstruction ambiguity.
Read the timelineBiography context
Explore South Africa through connected lives
Connected biographies
Researchers and context

1960–
Quarraisha Abdool Karim
Epidemiologist and HIV-prevention researcherQuarraisha Abdool Karim is an epidemiologist whose work connects women’s HIV-prevention research, the CAPRISA programme and long-term scientific training.Read biographyQuick answers
Common questions
- Does 39% mean 39 of every 100 women were protected?
- No. It describes a relative reduction in incidence rate under the study conditions, with statistical uncertainty.
- Why not call the raw event proportions fixed-time risks?
- Follow-up duration varied. A proportion over this dataset is not automatically a risk estimate for one specified follow-up time.
Primary and institutional sources
How this history was checked
Original records, selected source scopes and later institutional accounts are distinguished below. Exercises and diagrams are our own explanatory work. This article was reviewed on 28 October 2026.