
The short answer
What does an X-ray transmission measurement tell us, and why can a few combined readings leave more than one possible interior?
Read the evidence
What each observation can establish
Keep the measured quantity separate from the inference.
| Record or exercise | What is observed | What follows | Limit |
|---|---|---|---|
| Transmission model | g = ln(I₀/I) | Combined attenuation along a path | Not a direct photograph of internal cells. |
| Fictional A and B | Rows 3, 7; columns 4, 6 | Two candidate interiors fit | Four dependent totals are insufficient. |
| Extra fictional reading | Top-left cell = 1 | Selects A from these candidates | Not a complete clinical reconstruction algorithm. |
Chronology
A timeline of the turning points
Records in context
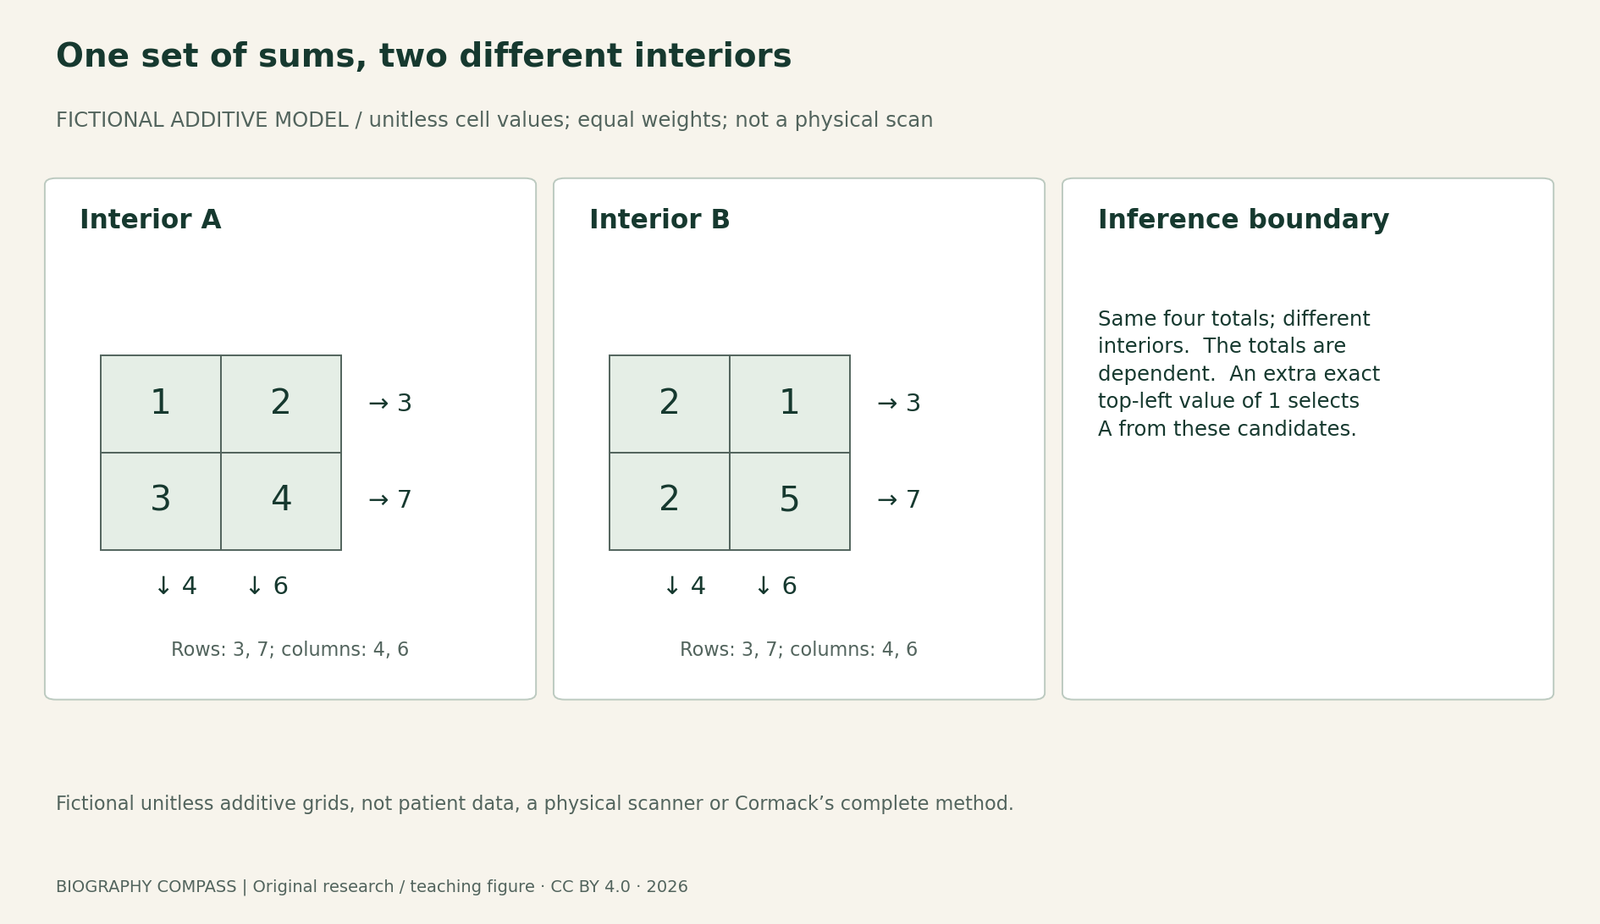
Fictional unitless additive grids, not patient data, a physical scanner or Cormack’s complete method.
From transmitted intensity to a path measurement
Cormack’s lecture writes logarithmic attenuation as g = ln(I₀/I), where I₀ is incident intensity and I is transmitted intensity. In the model discussed, this quantity represents accumulated attenuation along the ray’s path. A single path measurement therefore combines contributions from material encountered along that path.
The historical problem arose from material with varying attenuation, rather than a uniform object. Reconstructing that variation is an inverse problem: infer an internal distribution from observations made along paths. The measured number and the reconstructed distribution are different objects.
Sources for this section: [1]
Two different interiors with the same sums
Our fictional 2 × 2 model gives unitless additive cell values. Interior A has rows [1, 2] and [3, 4]. Interior B has rows [2, 1] and [2, 5]. In both, the row totals are 3 and 7 and the column totals are 4 and 6. Different internal values can therefore match these four stated sums.
This is a deliberately simplified ambiguity example, not a physical CT scan. Cell values, equal weights and row/column paths are supplied premises. It shows why these readings are insufficient; it does not prove that actual tomography is impossible or reproduce Cormack’s complete reconstruction method.
Sources for this section: [1]
Worked questions and the missing information
Question 1: verify the second column of B. Answer: 1 + 5 = 6, equal to A’s 2 + 4. Question 2: do four totals determine four cells uniquely? Answer: not here. The totals are dependent because the sum of the rows equals the sum of the columns. Counting equations alone misses that dependence.
Question 3: suppose an additional fictional, exact measurement directly gives the top-left cell as 1. Which of these two candidate interiors remains? Answer: A. That discriminates between these candidates. It is not a claim that one extra measurement solves every possible real scanner geometry, noise problem or arbitrary interior.
Sources for this section: [1]
What the historical record adds
Cormack’s lecture distinguishes the Cape Town hospital problem from his later experimental and mathematical work. His 1963–1964 publications and Hounsfield’s independent engineering contribution belong to the path towards the shared 1979 Nobel Prize in Physiology or Medicine. An equation alone was not a complete hospital scanner.
The selected opening lecture pages were inspected for the problem, equation and experimental account. This guide does not validate a clinical algorithm, specify radiation exposure or interpret a patient image. Its original diagram lets the reader check one precisely defined ambiguity by arithmetic.
Continue the chronology
Related history guides
Brenner’s Worm Genetics: Why 300 Mutants Were Not 300 Genes
Read Brenner’s 1974 mutant and gene counts alongside his later accounts, then practise distinguishing isolates, groups and genome claims with worked answers.
Read the timeline1982Klug, Tobacco Mosaic Virus and the Limits of a Structural Map
Use Aaron Klug’s 1982 lecture to distinguish a virus structure from its assembly pathway, read an aggregate boundary and practise evidence limits.
Read the timeline2010CAPRISA 004 in 2010: Incidence Rates, Risk and the 39% Result
Read the original CAPRISA 004 results, distinguish incidence rates from cumulative risk and work through person-time examples without overstating efficacy.
Read the timelineBiography context
Explore South Africa and United States through connected lives
Connected biographies
Researchers and context
1924–1998
Allan M. Cormack
Physicist and tomography researcherAllan M. Cormack investigated how measurements of X-ray attenuation could reveal an object’s interior, work recognised by a shared Nobel Prize in 1979.Read biographyQuick answers
Common questions
- Does this prove CT cannot reconstruct an interior?
- No. It proves only that the limited row/column readings in the explicitly simplified example are insufficient.
- Are the two-by-two grids Cormack’s experimental data?
- No. They are original fictional teaching values with a fully stated additive model.
Primary and institutional sources
How this history was checked
Original records, selected source scopes and later institutional accounts are distinguished below. Exercises and diagrams are our own explanatory work. This article was reviewed on 28 October 2026.