
The short answer
Two averages can point in opposite directions without an arithmetic contradiction. A historical employer report makes the issue visible, while the calculation guidance explains exactly what is being compared. The distinction matters before drawing conclusions about a workforce or an individual job.
The records answer different questions
Keep the measures separate
The question changes when the object, unit or reporting period changes.
| Record or measure | What it establishes | What it does not establish |
|---|---|---|
| Historical employer report | A combined UK population and two opposite-signed gaps. | The present global workforce or personal causation. |
| Calculation guidance | Different averages with the same male-pay denominator. | A finding about matched jobs. |
| Invented six-person data | Mean20%; median−33⅓%. | A legal conclusion or actual employee result. |
Chronology
A timeline of the turning points
Historical data
Reporting period used in the selected employer report.
Calculation guide
Selected EHRC guidance was published.
Start with the population and reporting period
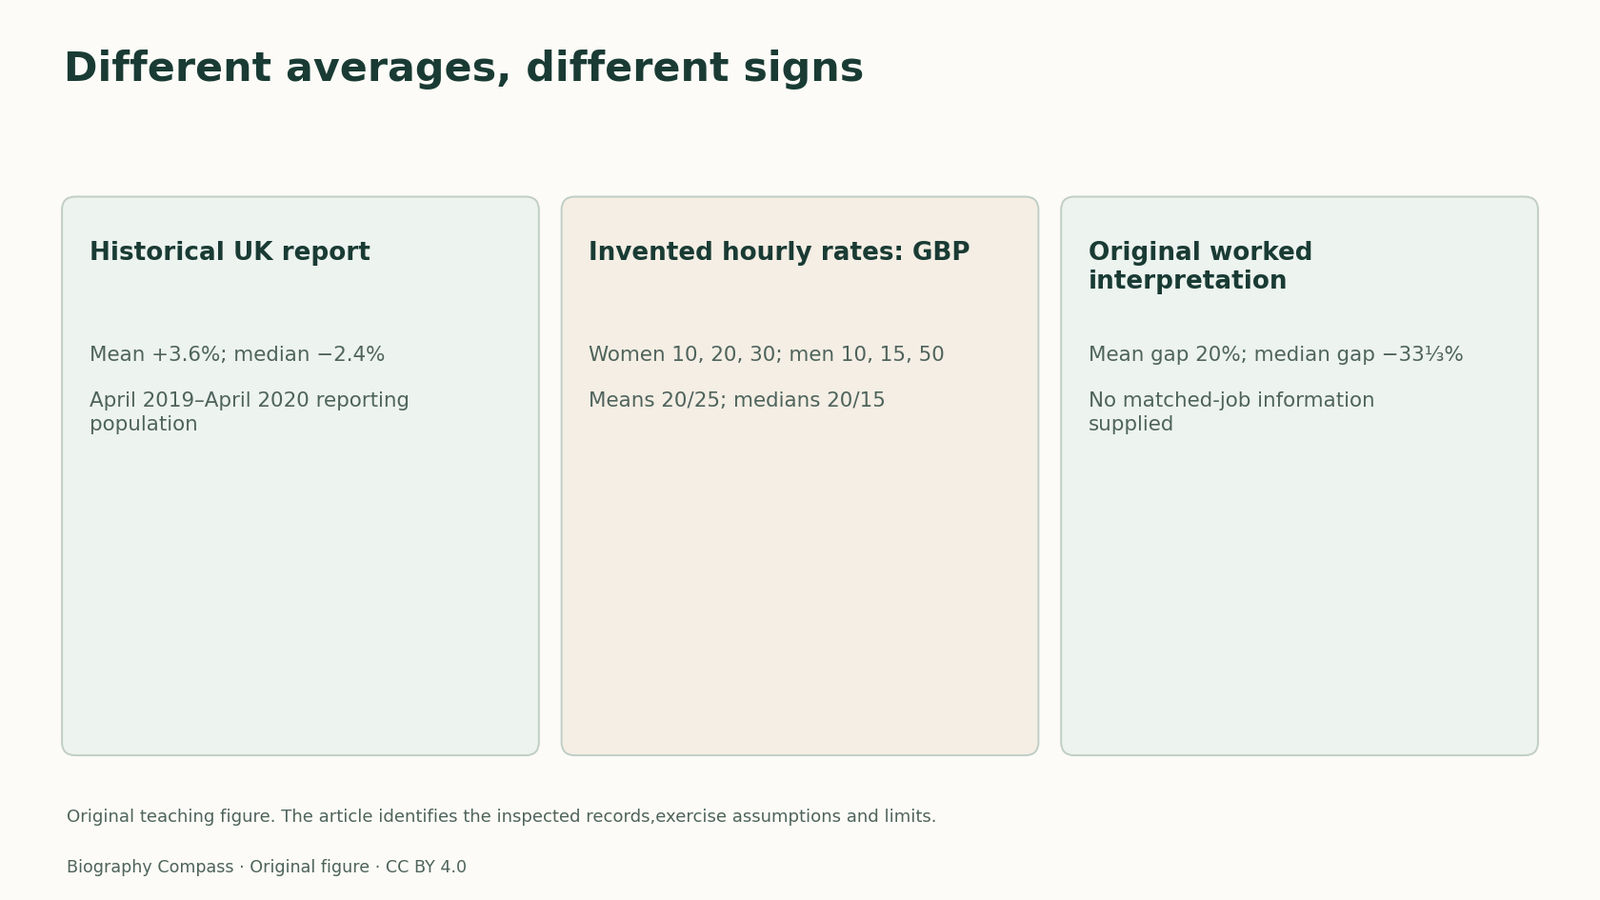
Unilever’s 2020 report combines UK Limited, UK Central Resources and UK-based executive-team members. Its pay and bonus data cover April 2019–April 2020. The combined mean hourly-pay gap is +3.6%; the median is −2.4%, using the convention that negative favours women.
Those are results for a specified reporting population. They cannot be relabelled as worldwide results or as the position in 2026. The two signs should prompt a look at the distributions and definitions, not an immediate claim that one number must be wrong.
Sources for this section: [1]
Mean, middle and the question of equal pay
The EHRC defines the mean by adding hourly rates and dividing by the number of employees, and the median by ordering rates and finding the middle. Its gap calculation subtracts women’s measure from men’s, divides by men’s measure and multiplies by 100.
The employer distinguishes aggregate gaps from equal pay for the same or similar work. A distribution can have a high upper tail and a different middle. The measures summarise those features; neither alone supplies job matching, responsibility, experience or a complete equal-work comparison.
Exercise: calculate the two signs
Use invented hourly rates in pounds: women £10, £20, £30; men £10, £15, £50. Treat each list as three people with equal observation weight. Calculate both group means and medians, then the two gaps using the stated denominator. Does either result establish whether employees doing the same work are paid equally?
Reference answer: women’s mean is £20 and men’s is £25, giving (25−20)/25×100 = 20%. Medians are £20 and £15, giving (15−20)/15×100 = −33⅓%. The mean favours men while the middle rate favours women. No employee’s job or work value is supplied, so the example cannot decide equal-pay compliance. These are invented people and rates, not reconstructed Unilever observations.
Sources for this section: [2]
An interpretation stronger than a slogan
A useful explanation names which average changed and which population it describes. It then separates the descriptive result from a proposed reason. To investigate further, request the underlying distribution and a defensible job-comparison design rather than treating one percentage as a complete account of fairness.
The lesson applies to reading workforce reports: inspect scope, statistic and denominator before assigning credit or blame. The historical report and selected guidance supply the definitions used here. The example is a statistical exercise, not present employment-law advice or an assessment of any worker’s claim.
Continue the chronology
Related history guides
Biography context
Explore United Kingdom through connected lives
Connected biographies
The connected careers

Quick answers
Common questions
- Does a negative gap prove equal pay?
- No. An aggregate midpoint does not compare the pay of people doing equivalent work.
Primary and institutional sources
How this history was checked
Compare the dated company records with the independent or regulatory context. Original task inputs are labelled separately from reported historical measures. This article was reviewed on 31 October 2026.