
The short answer
In December 2021, material moved rapidly down the slopes of Semeru in East Java. Ground observations described hot currents and lahars. Radar images taken before and after the event gave another record of the ground that changed. The products answer related questions, with different limits on what each can identify.
Reading the records
Three observations in the Semeru record
Read each record for the physical process or surface change it can establish.
| Record | Measures | Meaning |
|---|---|---|
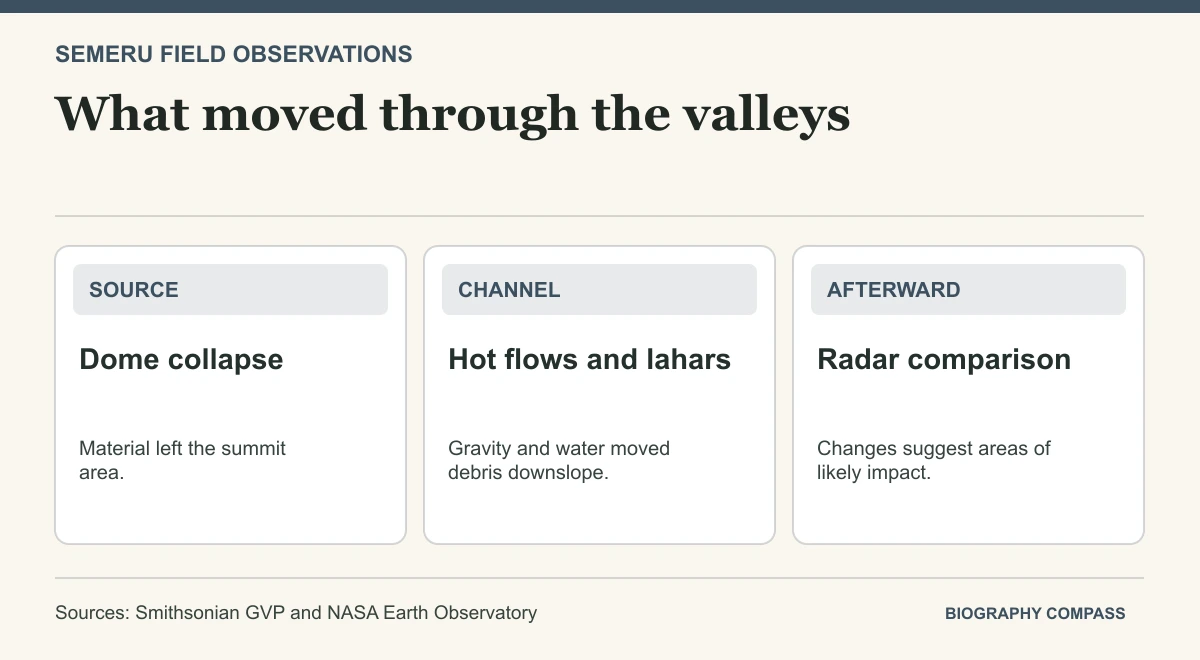
| Dome observation | Change near the summit | Evidence for collapse at the source. |
| Valley observations | Hot currents and water-rich debris | Evidence of movement down the mountain. |
| Radar comparison | Changes on the ground between images | An indication of likely impact, to be checked on site. |
Chronology
A timeline of the turning points
Partial summit dome failure
PVMBG observations identified activity ahead of the larger collapse.
Destructive currents descended
Reports described pyroclastic currents and subsequent flows of remobilised material.
Radar imagery acquired
An image acquired after the event was compared with earlier scenes.
How material left the dome
The bulletin and NASA’s account draw on observations from Indonesia’s volcanological authorities. They describe a partial collapse and a larger episode on 4 December that sent hot mixtures down the mountain. A pyroclastic current is driven by gravity and can contain gas, ash and rock. It follows a different route and process from an ash cloud drifting aloft.
Rain can change how loose deposits move
A lahar is a water-rich flow carrying sediment. As volcanic debris mixes with rainwater and runoff, it can move again along channels. NASA’s synthesis reports both hot currents and water-rich debris in the Semeru episode. Keeping these terms distinct helps explain why valley impacts can continue after the initial material has moved off the slopes.
A damage proxy is a site-screening tool
The radar analysis compared an image from 7 December with several pre-event scenes. NASA describes the resulting map in terms of likely damage and surface change, with each coloured pixel about 30 metres on a side. The image helps identify affected areas. Confirming the type of damage to a particular building or field requires a separate observation.
Sources for this section: [2]
Continue the chronology
Related history guides
Connected biographies
People in this history
Quick answers
Common questions
- What is the difference between a lahar and a pyroclastic current?
- A lahar is a water-rich sediment flow. A pyroclastic current moves hot gas and volcanic material down slopes.
- Does the damage proxy map identify exact building losses?
- It indicates likely surface changes at the mapped resolution. Field checks are needed for individual structures.
Primary and institutional sources
How this history was checked
Dates, legal milestones and historical claims are checked against the official and institutional records below. This article was reviewed on 19 November 2026.