
The short answer
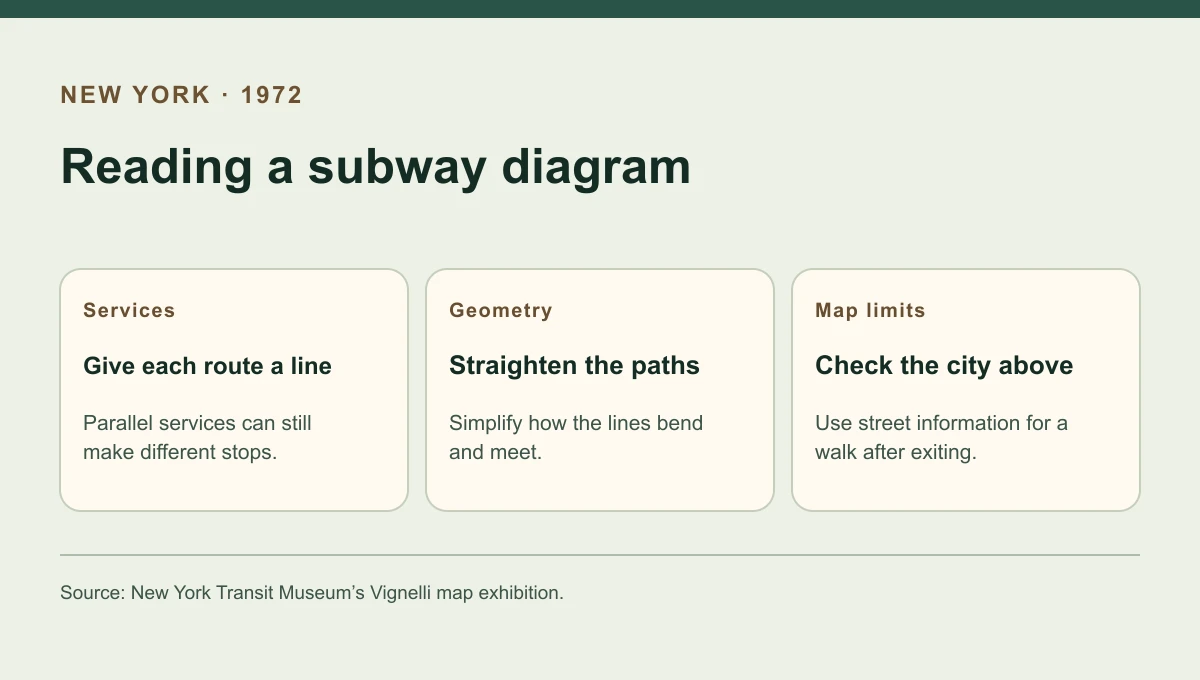
The New York City Transit Authority introduced the Vignelli subway map in August 1972. Its rails ran through a city made from a few shapes and bodies of water. The diagram gave each subway service its own drawn line, making the task of following a numbered or lettered train central to the page. People still needed to know where the ride would leave them above ground.
Compare the visual choices
Three ways the diagram recast the city
A choice that clarifies a rail service can take away a clue a rider uses above ground.
| Design choice | What the reader gains | What takes separate checking |
|---|---|---|
| Separate service line | A visible path for an individual train service | Whether a similar service makes the same stops |
| Regular angles | A relatively easy line to trace | The real shape of a street or track alignment |
| Simplified land | More room for route labels and connections | Which end of a park or neighbourhood a station serves |
Chronology
A timeline of the turning points
NYCTA brings in Unimark
Wayfinding and sign standards create a broader design assignment.
NYCTA issues the new map
The new drawing gives routes and transfers visual priority.
NYCTA adopts a new design
A committee-backed map restores a greater role for street geography.
The name on the cover and the people behind it
Massimo Vignelli became the best-known name associated with the diagram. The Transit Museum places the work inside Unimark International and credits the wider effort, including firm principals Vignelli and Bob Noorda and designer Joan Charysyn. That distinction matters because the design emerged from a transit information programme that included signs, graphics and production work. Charysyn subsequently worked on the MTA’s commuter rail map, extending the approach to another passenger publication.
Reading a particular train
A reader could follow an individual coloured line across the page. Several trains might use the same broad corridor while differing in their stops or branch destinations. Separate drawn paths make those differences easier to see. The simplified city meanwhile gives the lines the room they need. A square shape on the page may be good for leaving space for the tracks even if it is a poor guide to the proportions of a park.
What changed in 1979
The Transit Museum traces later revisions to the Unimark design and the start of a replacement effort in 1975. The 1979 map brought back a stronger geographical frame and grouped services by shared trunk colours. The contrast exposes two reasonable reading priorities. One puts the route trace first. The other helps the passenger recognise the larger corridor and relate the station to a place on the surface.
Continue the chronology
Related history guides
How Mexico City’s Metro Gave Each Station an Icon
Read how Mexico City used local images to distinguish individual stations.
Read the timeline1931–1933How Harry Beck Redrew the London Underground Map
Compare schematic line drawing with the earlier London diagram.
Read the timeline1966–1970What New York’s 1970 Subway Sign Manual Standardised
Read the sign manual that dealt with instructions inside the same subway.
Read the timeline1975–1979Why New York Replaced the Vignelli Subway Map in 1979
See why the 1979 map restored geography and regrouped routes by colour.
Read the timelineConnected biographies
People connected to this history
Quick answers
Common questions
- When did the Vignelli map enter use?
- The New York City Transit Authority debuted it in August 1972.
- Who worked on the map besides Vignelli?
- The Transit Museum credits Unimark International and names Bob Noorda and Joan Charysyn among those involved in its design history.
Primary and institutional sources
How this history was checked
Dates, legal milestones and historical claims are checked against the official and institutional records below. This article was reviewed on 19 November 2026.