
The short answer
A small chance for one new copy can coexist with a large population supplying more copies. The quantities must be multiplied only after their units and assumptions have been stated.
Evidence and original analysis
Probability and supply have different units
All population sizes and μ values are invented.
| Ideal N | New copies / generation | Probability × supply |
|---|---|---|
| 100 | 0.000002 | 0.005×0.000002=10⁻⁸ |
| 1000 | 0.00002 | 0.0005×0.00002=10⁻⁸ |
| Comparison | Supply increases tenfold | Individual chance decreases tenfold |
Chronology
A timeline of the turning points
Selected record
Historical scope for this question.
Original exercise
Invented inputs and analysis, not reconstructed observations.
A single-copy probability
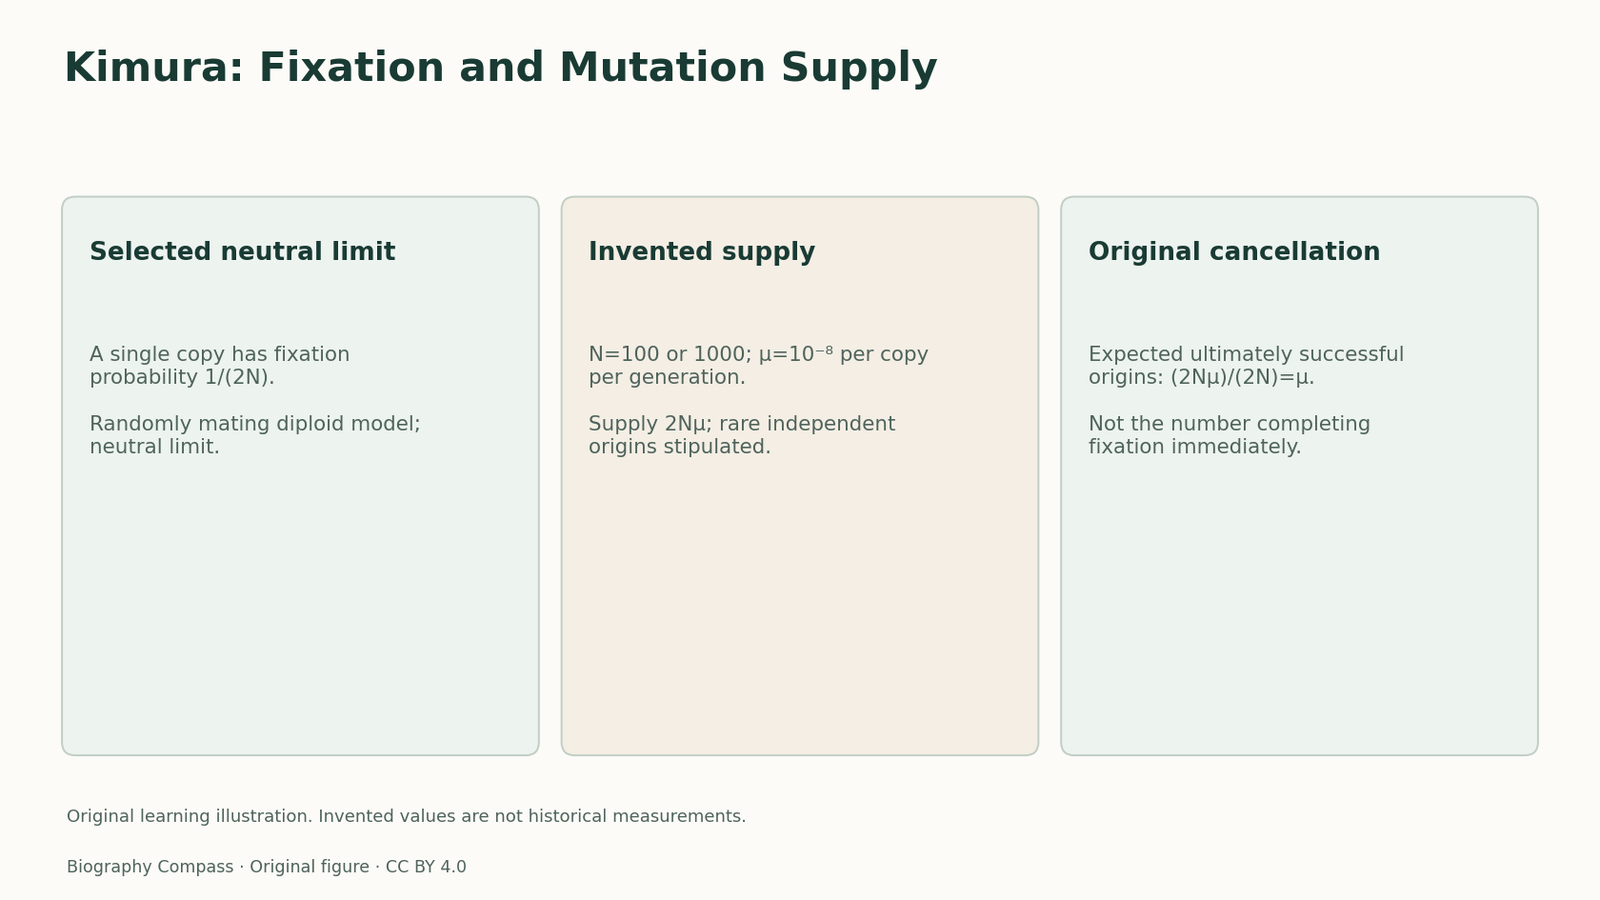
Kimura defines the chance that a single new copy ultimately fixes in a randomly mating diploid population. With N reproducing individuals, the starting frequency is 1/(2N). In the neutral limit the fixation probability is also 1/(2N).
The factor two counts copies in this diploid model. N is the idealised reproducing population used by the model, not a universal substitute for every census or effective population measure.
Sources for this section: [1]
An original rare-mutation comparison
Use two ideal populations, N=100 and N=1000. Invent a mutation probability μ=10⁻⁸ per copy per generation at a focal site. Stipulate rare, neutral, independent origins, with no interference, migration or later mutation in each tracked lineage. Expected new copies per generation are 2Nμ by this fixture’s accounting.
Calculate new-copy supply, the probability for each single origin, and expected ultimately fixing origins arising per generation. Keep “arising now and ultimately fixing” separate from “fixing during this generation.”
Sources for this section: [1]
Reference answer
For N=100, supply is 200×10⁻⁸=0.000002 new copies per generation and each has probability 1/200=0.005. Their product is 10⁻⁸ expected ultimately successful origins per generation.
For N=1000, supply is 2000×10⁻⁸=0.00002 and probability 1/2000=0.0005. The product is again 10⁻⁸. More origins exactly offset the smaller individual probability under these assumptions.
This accounting says nothing about how long fixation takes. It is an expectation over hypothetical origins, not a prediction that a population fixes a fractional copy immediately.
Sources for this section: [1]
What the cancellation does not establish
The later molecular-rate abstract argues for many neutral substitutions.
Our cancellation illustrates a conditional neutral model; it does not prove that all observed changes were neutral. Selection, structure, non-diploid inheritance or interacting mutation histories require a different analysis. The two publication records have different scopes and dates.
Continue the chronology
Related history guides
Biography context
Explore Worldwide through connected lives
Connected biographies
Researcher and context
Quick answers
Common questions
- Is 1/(2N) a universal fixation probability?
- No. It is the stated neutral single-copy diploid case.
- Does equal expected success imply equal fixation time?
- No. No time-to-fixation calculation was supplied.
Primary and institutional sources
How this history was checked
Selected record passages ground the historical explanation. Original fixtures and answers are labelled separately. This article was reviewed on 31 October 2026.