
The short answer
A loss quoted per kilometre is not yet a whole-route loss. This lesson first compares what the historical record proposed and measured, then asks what happens when two stipulated sections are joined.
Historical record and original analysis
Three different statements
Ask which quantity each statement actually supplies.
| Statement | Quantity | Reading consequence |
|---|---|---|
| Historical forecast | 20 dB/km | A proposed coefficient, with a wavelength and material context. |
| Invented section A | 3 dB/km over 2 km | 6 dB total. |
| Invented whole route | 10 dB over 3 km | 0.1 surviving fraction. |
Chronology
A timeline of the turning points
A proposal
Low-loss glass forecast.
A manufactured fibre
Corning result recalled retrospectively.
Forecast, bulk measurement and fibre
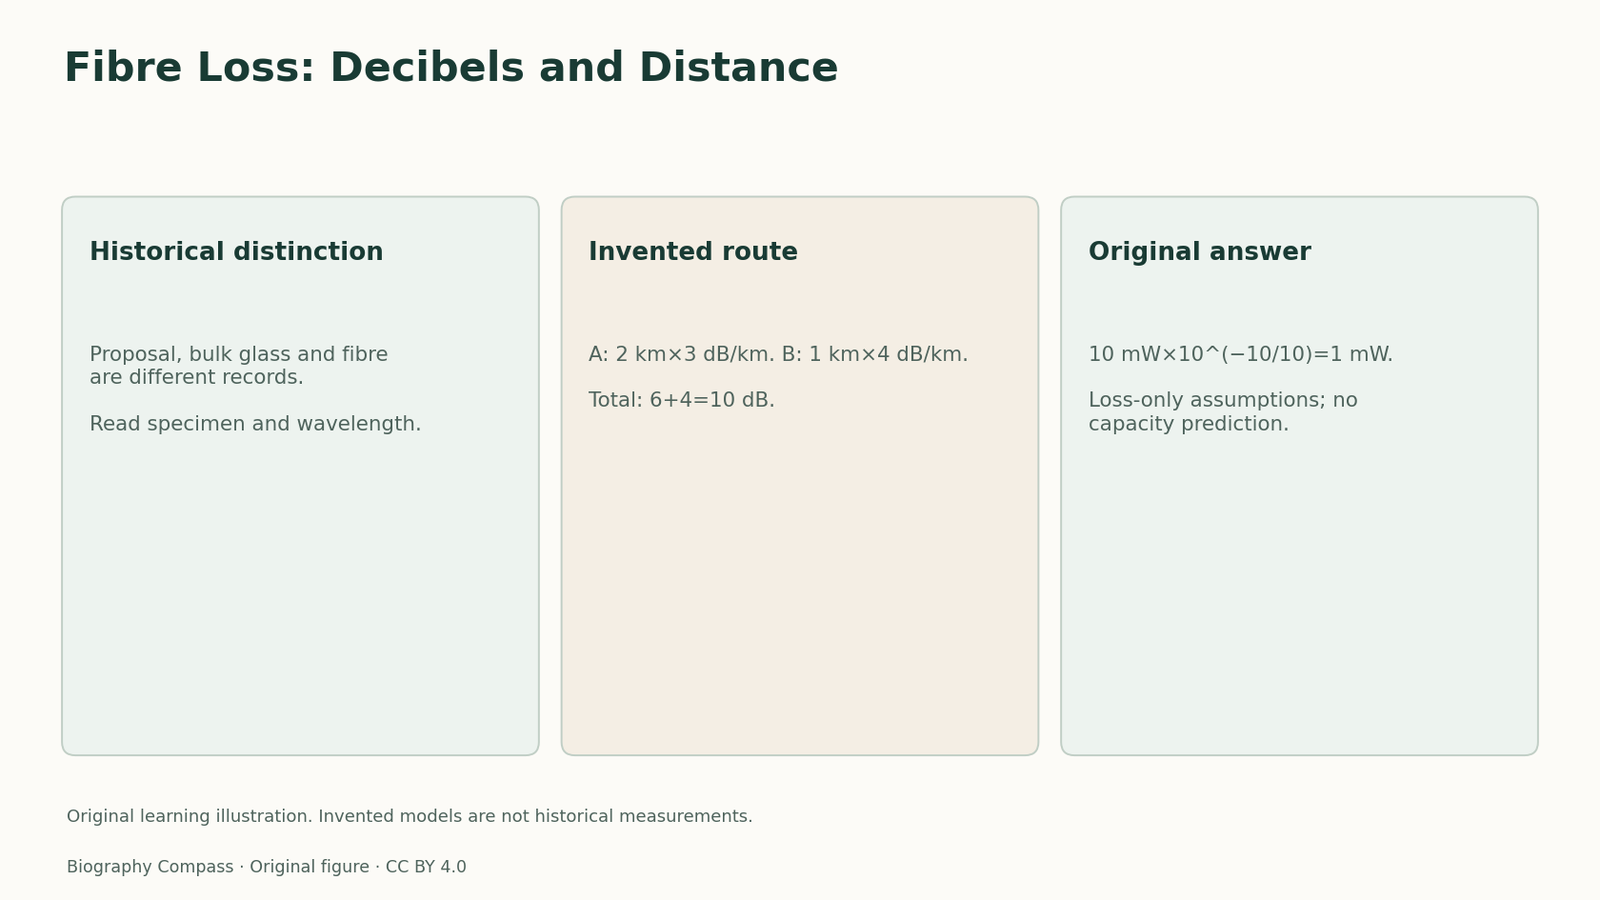
Kao’s 2009 lecture recalls a 1966 forecast of about 20 dB/km near 0.6 micrometres. It separately describes a 5 dB/km bulk-glass measurement near 0.85 micrometres and Corning’s 1970 fibre at 17 dB/km near 0.633 micrometres.
These are not three interchangeable points on one controlled test. The specimen type and wavelength differ, and the lecture is a later account of earlier work. The historical answer is that evidence accumulated through a materials proposal, difficult measurement and fibre manufacture, rather than through a single number alone.
Sources for this section: [1]
Define the calculation
For a power ratio, decibels use 10 log10(P/P0). For positive attenuation define L=10 log10(Pin/Pout), hence Pout/Pin=10^(−L/10).
For the invented route below, assume a fixed attenuation coefficient alpha in each section, with L=alpha×length. Ignore connectors, bending, wavelength changes and all other losses. This is a stipulated loss-only model, not a historical deployment or an engineering recommendation.
Sources for this section: [2]
Audit an invented route
A fictional route has section A: 2 km at 3 dB/km and section B: 1 km at 4 dB/km. The launch power is 10 mW. Find each section’s loss, the total surviving fraction and the received power. Then assess the claim that the coefficient for the whole route is simply 3+4=7 dB/km.
Reference answer: A loses 6 dB and B loses 4 dB, so the total is 10 dB. The surviving fraction is 10^(−1)=0.1 and the received power is 1 mW. The two individual fractions are about 0.25119 and 0.39811; their product is 0.1.
The claimed 7 dB/km coefficient is wrong for these stipulated lengths. The route-average coefficient is 10/3, about 3.333 dB/km. A rate cannot be added as though it were a total when the lengths to which it applies differ.
Sources for this section: [2]
What remains unanswered
The same loss fraction could occur on routes of different lengths and at different launch powers. Neither the scalar loss budget nor the retrospective measurements alone specify usable information capacity, dispersion, noise or receiver performance. The calculation answers the deliberately narrow power question and leaves those other questions open.
Continue the chronology
Related history guides
Biography context
Explore United Kingdom through connected lives
Connected biographies
The researcher behind the record
Quick answers
Common questions
- Does a smaller loss guarantee greater information capacity?
- No. This calculation does not model the other properties required to answer that question.
- Can attenuation coefficients simply be added?
- First multiply each coefficient by its own length; in the stated loss-only model, add the resulting decibel losses.
Primary and institutional sources
How this history was checked
Selected original records are identified below. Invented inputs and calculations are labelled separately from historical observations. This article was reviewed on 31 October 2026.