
The short answer
Why was a weekly wage when employed different from the mapped family average?
Evidence comparison
Read the records together
The records were created for different purposes and support different kinds of claims.
| Record | What it establishes | Question to keep open |
|---|---|---|
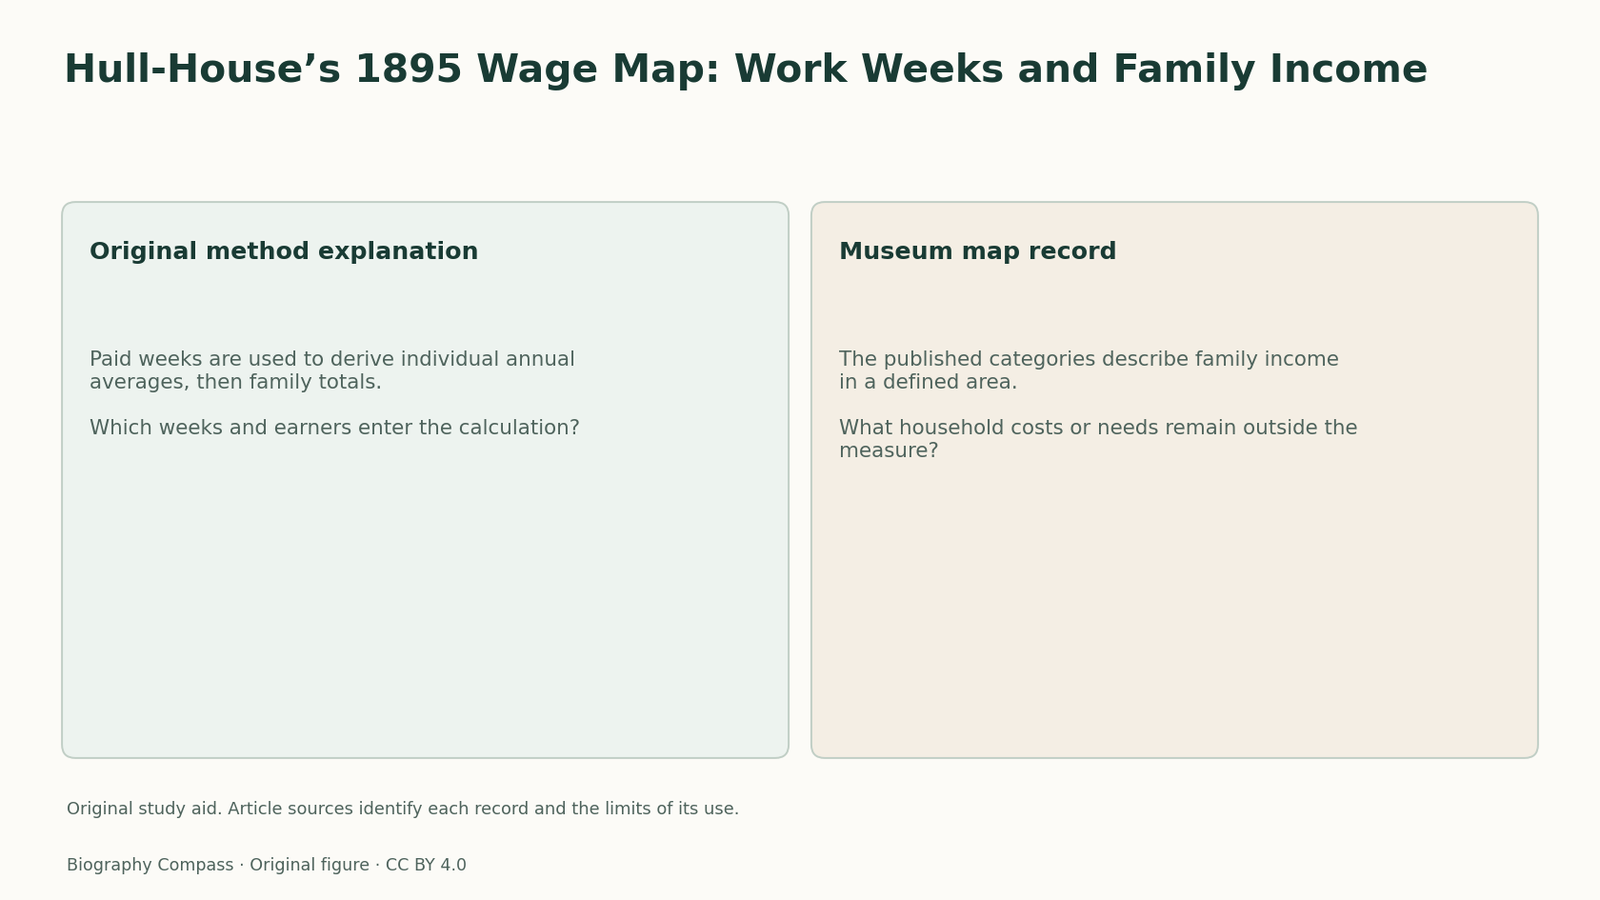
| Original method explanation | Paid weeks are used to derive individual annual averages, then family totals. | Which weeks and earners enter the calculation? |
| Museum map record | The published categories describe family income in a defined area. | What household costs or needs remain outside the measure? |
Chronology
A timeline of the turning points
Hull-House established
The settlement begins its neighbourhood work.
Maps published
Collaborative research appears in Maps and Papers.
Identify the wage being recorded
The mapping explanation distinguishes a worker’s weekly wage while employed from average earnings across the year. It accounts for weeks without work before calculating an annual weekly average. This is essential when interpreting a wage category. A household receiving a seemingly adequate weekly rate during employment could have much less income across a year interrupted by unemployment. The map’s method tried to retain that difference instead of assuming continuous paid work.
Sources for this section: [2]
Follow the family aggregation
After calculating individual annual averages, the method added the amounts for members of a family. The published wage map therefore represented family earnings rather than one worker’s wage rate. The museum record identifies the neighbourhood and the map’s wage categories. Together the records show why both the unit of observation and the unit displayed need attention: a family total can combine several earners with very different employment histories.
Use an original worked example
Suppose an invented worker earns ten dollars in each of twenty-six paid weeks and nothing during the remaining twenty-six. The annual total is 260 dollars, equivalent to five dollars a week across fifty-two weeks. A second earner’s comparable average would then be added for a family total. These are hypothetical numbers illustrating the published method; they are not a reconstructed Hull-House household or a claim about a named resident’s circumstances.
Sources for this section: [2]
State what the map leaves open
The calculation helps compare income but does not by itself supply family size, rent, illness or every unpaid form of work. Nor should the settlement’s social mission be used to fill those missing details. A useful annotation gives the category, family unit and averaging period, then names one further question about living costs. This lets the map’s analytical strength remain visible without treating a compressed income measure as a complete description of household welfare.
Continue the chronology
Related history guides
Biography context
Explore United States through connected lives
Connected biographies
People behind the records
1860–1935
Jane Addams
Settlement organiser and peace campaignerAddams helped establish Hull-House in 1889, connecting neighbourhood services, social investigation and later national and international peace work.Read biographyQuick answers
Common questions
- Does a mapped family figure equal one person’s wage rate?
- No. The method adjusts for employment across the year and combines the relevant averages of family earners.
Primary and institutional sources
How this history was checked
Sources support the chronology and the record comparison. The reading exercise is original. This article was reviewed on 7 November 2026.