
The short answer
A small dividing cell can result from several changes. Following length and time separately is a way to turn size into evidence.
Evidence at a glance
Does dividing at a smaller size imply slower growth?
Read each observation alongside the particular inference it supports.
| Record or example | Observation | Interpretation |
|---|---|---|
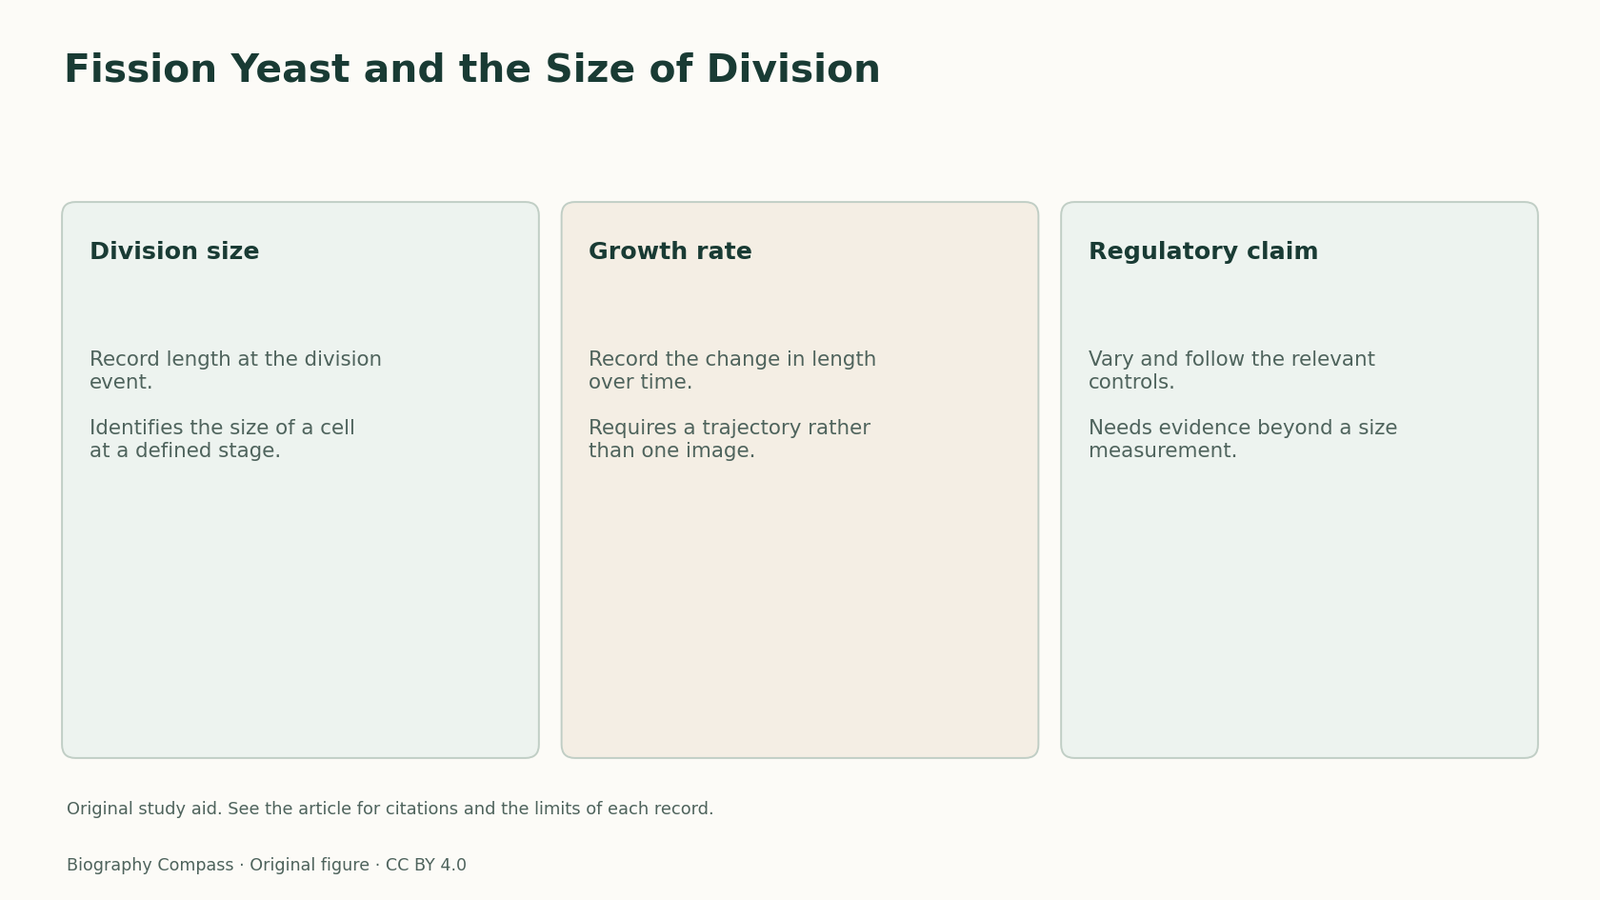
| Division size | Record length at the division event. | Identifies the size of a cell at a defined stage. |
| Growth rate | Record the change in length over time. | Requires a trajectory rather than one image. |
| Regulatory claim | Vary and follow the relevant controls. | Needs evidence beyond a size measurement. |
The accessible record
The 1975 paper describes a fission-yeast mutant that divided at roughly half the size of the wild type under the conditions reported. Nurse treated this phenotype as a way to examine control over cell-cycle events. The abstract’s conclusion distinguishes size control associated with DNA synthesis and nuclear division. It does not make every measurement of cell length a measure of growth rate.
Sources for this section: [2]
Read two quantities separately
Consider two invented cells starting at length four units and lengthening at one unit per hour. One divides at length eight after four hours. The other divides at length six after two hours. Their growth rates are equal by construction. The sizes at division differ because the modeled division rules differ. These numbers are original and do not approximate the historical mutant.
Choose a comparison that answers the question
In a second invented example, a slow-growing cell and a fast-growing cell both divide at eight units. Their lengths at division are equal, though one takes longer to get there. The two cases tell a reader what to measure: follow size through time, note the stage of the cell cycle and compare cells in matched conditions. A single image can show size; the trajectory is needed for rate.
Separate the phenotype from a molecular account
The phenotype makes a control problem visible. Genetic analysis and subsequent experiments are needed to identify a regulator and establish its role. Nurse’s lecture traces later links to a conserved control system. Readers can compare the short 1975 abstract with that retrospective and mark which conclusions are in the original accessible record and which depend on later work.
Continue the chronology
Related history guides
Biography context
Explore United Kingdom through connected lives
Connected biographies
The researcher behind the records
born 1949
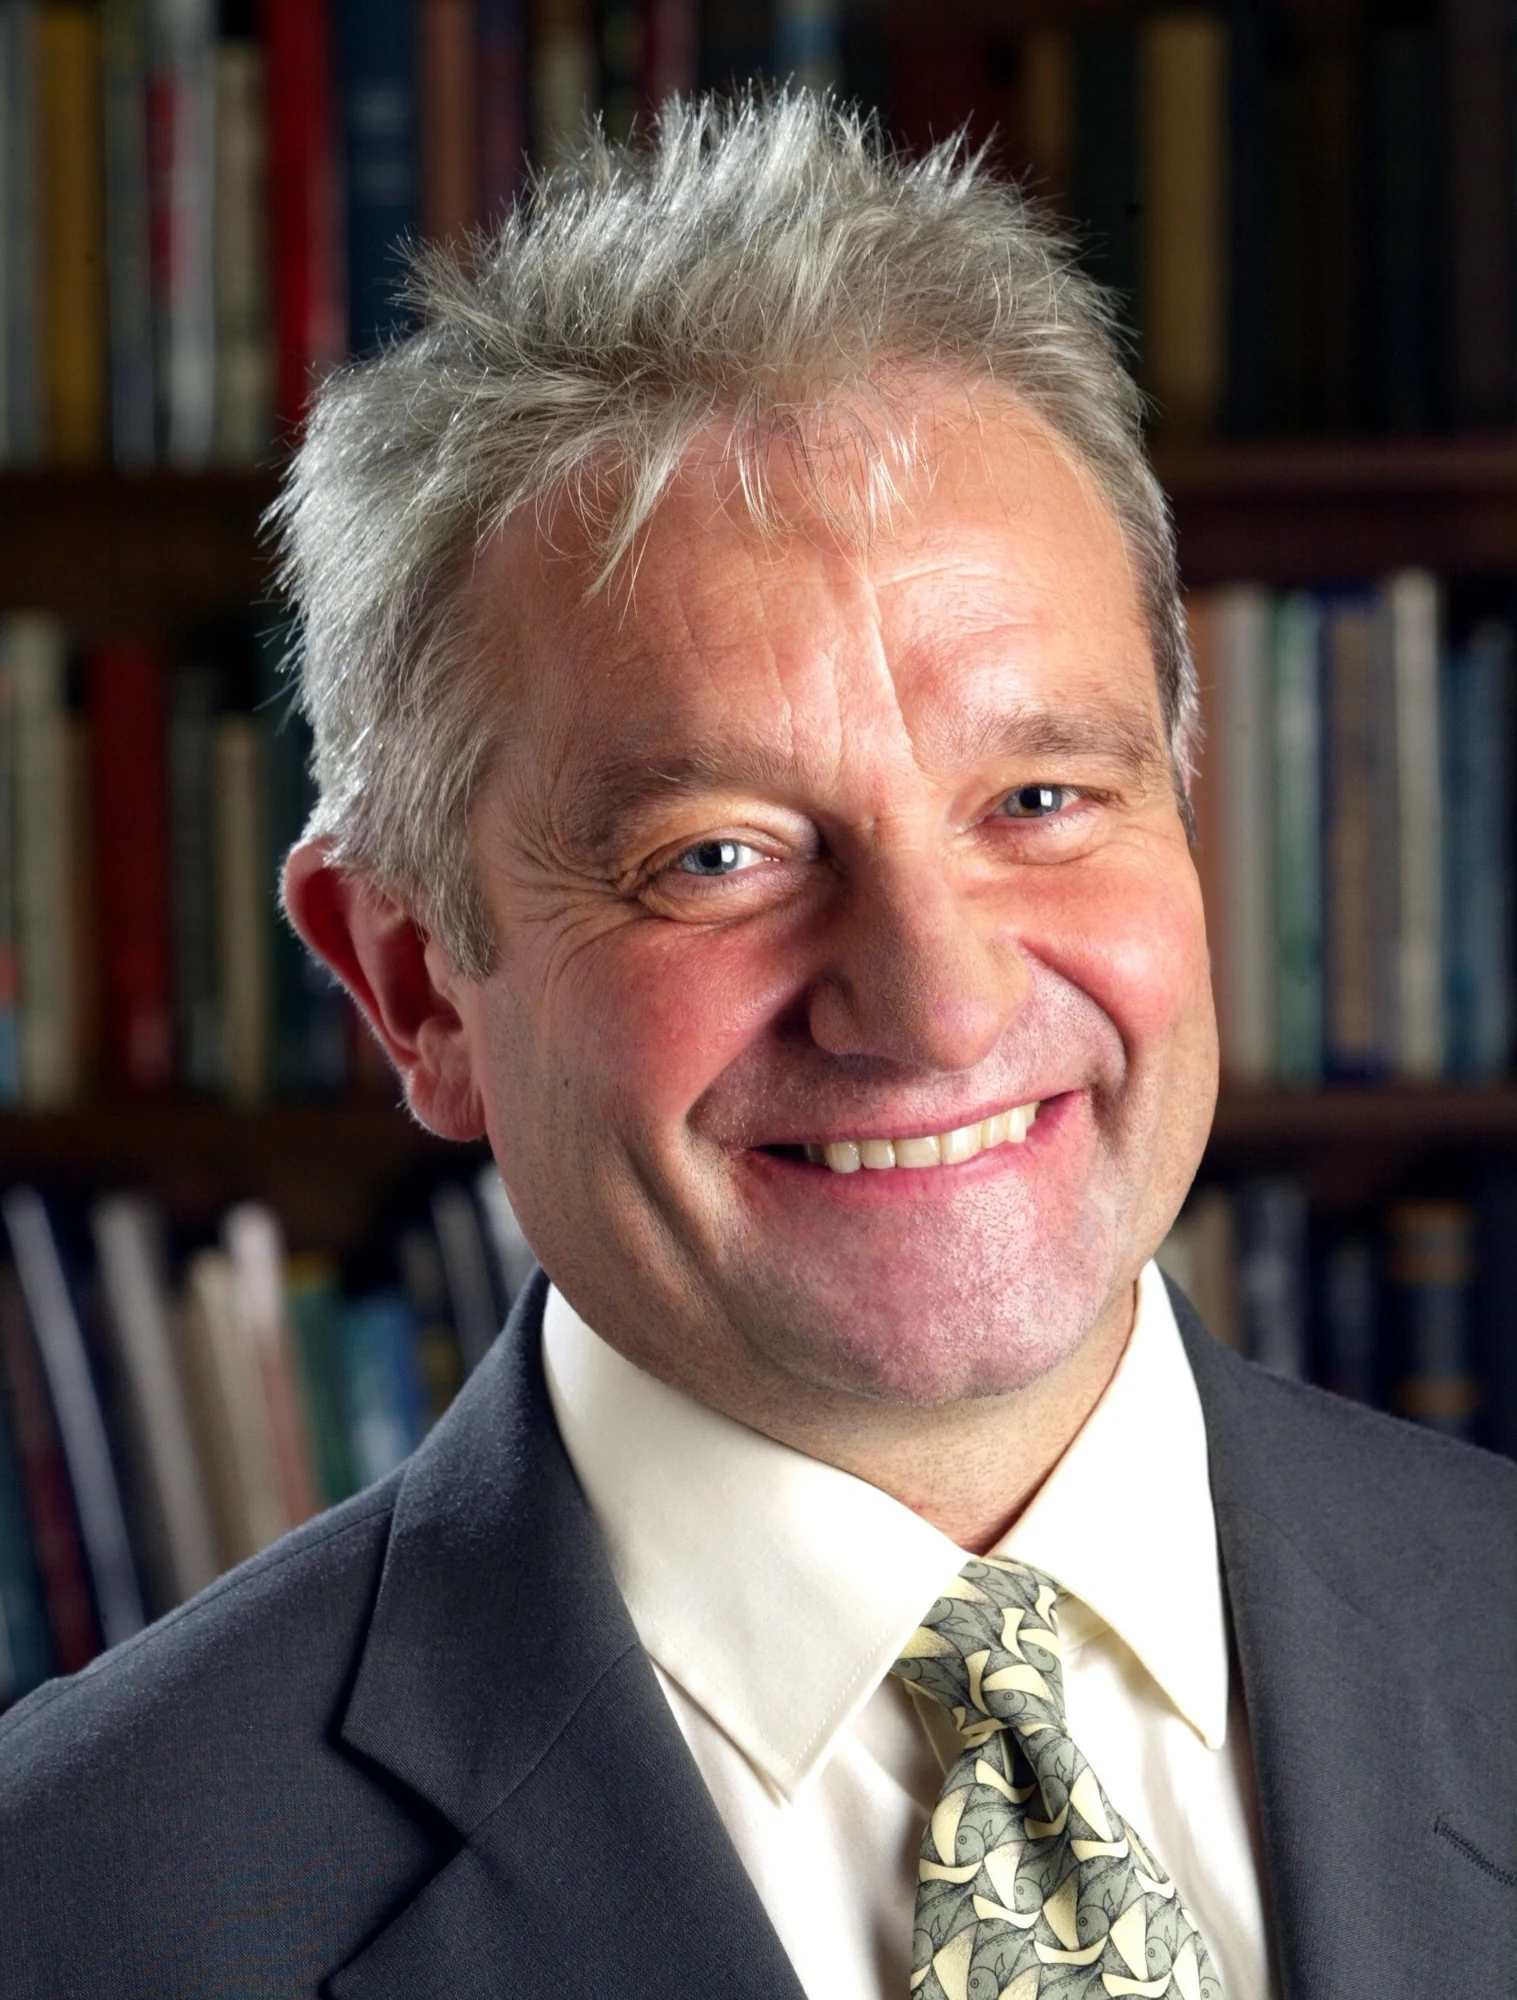
Paul Nurse
Cell-cycle geneticistNurse used fission yeast to study how cells decide when to divide.Read biographyQuick answers
Common questions
- Could two cells have equal growth rates and different division sizes?
- Yes. The original example assigns equal lengthening rates and different lengths at division.
Primary and institutional sources
How this history was checked
The notes distinguish period evidence, later interpretation, and original exercises. This article was reviewed on 5 November 2026.