
The short answer
How can astronomers measure the spread of stellar motions in a galaxy whose individual stars are unresolved?
Read the evidence
What each quantity tells us
Keep measurements and inferred quantities separate.
| Quantity | Evidence | Interpretation |
|---|---|---|
| Velocity dispersion | Broadening of features in integrated light | Spread of stellar line-of-sight velocities |
| Luminosity | Observed brightness and estimated distance | Power emitted in a measured band |
| Mass | Velocity information, scale and dynamical model | Estimate conditional on model assumptions |
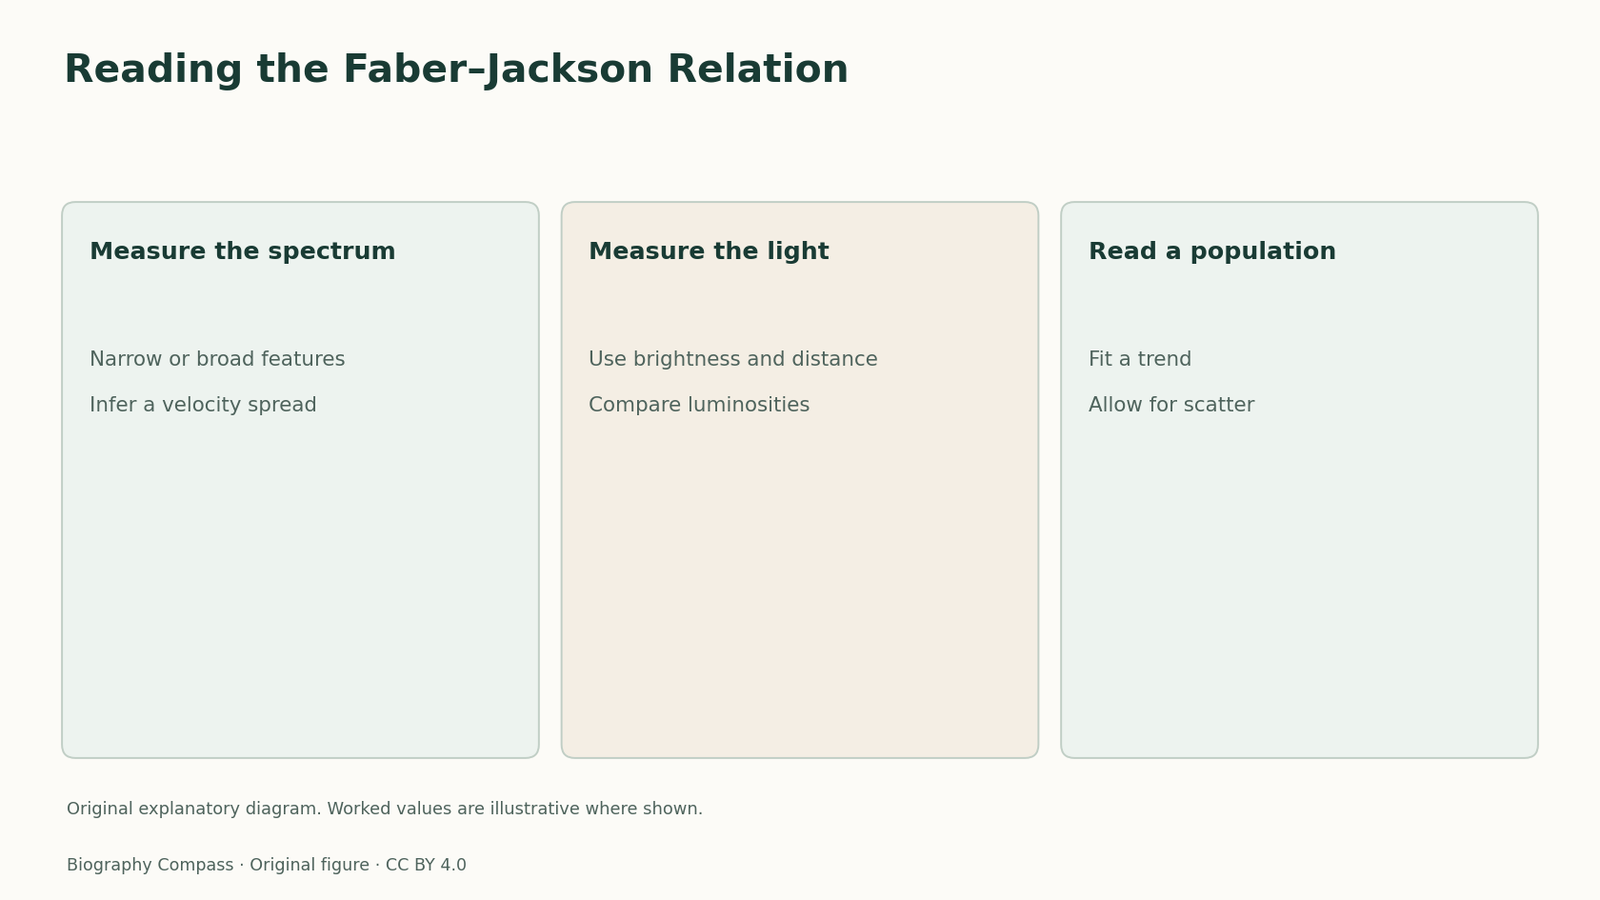
Read the width of a spectral feature
An absorption feature from one star can appear at a slightly shifted wavelength if that star is moving toward or away from the observer. A galaxy spectrum combines light from many stars. Their range of line-of-sight velocities can broaden a feature in the combined light. Recovering a velocity dispersion means estimating that range after allowing for the instrument and the shapes of the stellar features. Faber and Jackson compared conventional and Fourier methods in their study. The number reported for each galaxy came from a measurement procedure, so its precision belongs in the interpretation.
Sources for this section: [2]
Separate the two axes
Velocity dispersion describes the spread of speeds along the line of sight. Luminosity describes the power emitted in a given band, with a distance needed to infer it from apparent brightness. Faber and Jackson found that brighter normal ellipticals in the studied comparison tended to have higher central dispersions. One could present that pattern in a plot with a point for each galaxy. The relation is clearer when the reader can see which observations entered each axis and how the central measurement was distinguished from a property of the galaxy as a whole.
Sources for this section: [2]
Read a sample with scatter
Imagine three elliptical galaxies with central dispersions of one hundred, one hundred fifty and two hundred kilometres per second. Give them increasing luminosities in the same band. A fourth galaxy has the middle dispersion and a luminosity above the other two. The first three illustrate a trend, and the fourth shows why a fitted relation needs a measure of scatter. Depending on the sample and model, one unusual point can shift the estimate of the relationship. The made-up values illustrate how to read a plot, with no inference about the actual galaxies in the 1976 paper.
Distinguish luminosity and mass
Galaxies with equal luminosity can have different masses and different stellar populations. To estimate a mass from stellar motions, an astronomer needs a model relating the measured velocities to gravitational forces and a physical size. Faber and Jackson discussed luminosity and mass-to-light ratio in separate parts of their analysis. This matters when summarising the relation. The two measured quantities usually named in the relation are luminosity and velocity dispersion. A statement about how much matter is present relies on additional observations and assumptions that should be stated separately.
What later comparisons can test
A new study can measure similar quantities for a larger sample or distinguish different classes of galaxy. A fit may change if the sample includes a broader range of luminosities or if a different band is used. Read a later use of the Faber–Jackson relation by asking which objects were selected and how their dispersions were measured. Those choices determine whether its slope and scatter can be compared directly with the original. The 1976 paper is evidence of an observed trend in a particular analysis, and the usefulness of the trend depends on describing how it was obtained.
Continue the chronology
Related history guides
Biography context
Explore Santa Cruz, United States through connected lives
Connected biographies
Researchers and collaborators
1944–
Sandra Faber
Astronomer of galaxies and their stellar motionsFollow Sandra Faber from Swarthmore and Harvard to UC Santa Cruz, including her 1976 study with Robert Jackson on elliptical galaxies.Read biography1957–
Wendy Freedman
Observational cosmologist of the distance scaleFollow Wendy Freedman from Toronto to Carnegie and Chicago, including her work with Robert Kennicutt and Jeremy Mould on cosmic expansion.Read biographyQuick answers
Common questions
- What does the relation compare?
- It links luminosity to stellar velocity dispersion in elliptical galaxies.
- Does the relation give an exact mass?
- A mass estimate requires a dynamical model and information beyond the observed correlation.
Primary and institutional sources
How this history was checked
Dates, legal milestones and historical claims are checked against the official and institutional records below. This article was reviewed on 13 November 2026.
- University of California, Santa CruzAstronomer Sandra Faber awarded Royal Astronomical Society’s Gold Medal
- Sandra M. Faber and Robert E. Jackson, Astrophysical Journal, 1976Velocity dispersions and mass-to-light ratios for elliptical galaxies
- Sandra M. Faber and John S. Gallagher, Annual Review of Astronomy and Astrophysics, 1979Masses and Mass-to-Light Ratios of Galaxies