
The short answer
A poverty map is a powerful summary. The notebooks reveal some of the decisions and local information from which that summary was made.
Evidence comparison
Read the records together
The records were created for different purposes and support different kinds of claims.
| Record | What it establishes | Question to keep open |
|---|---|---|
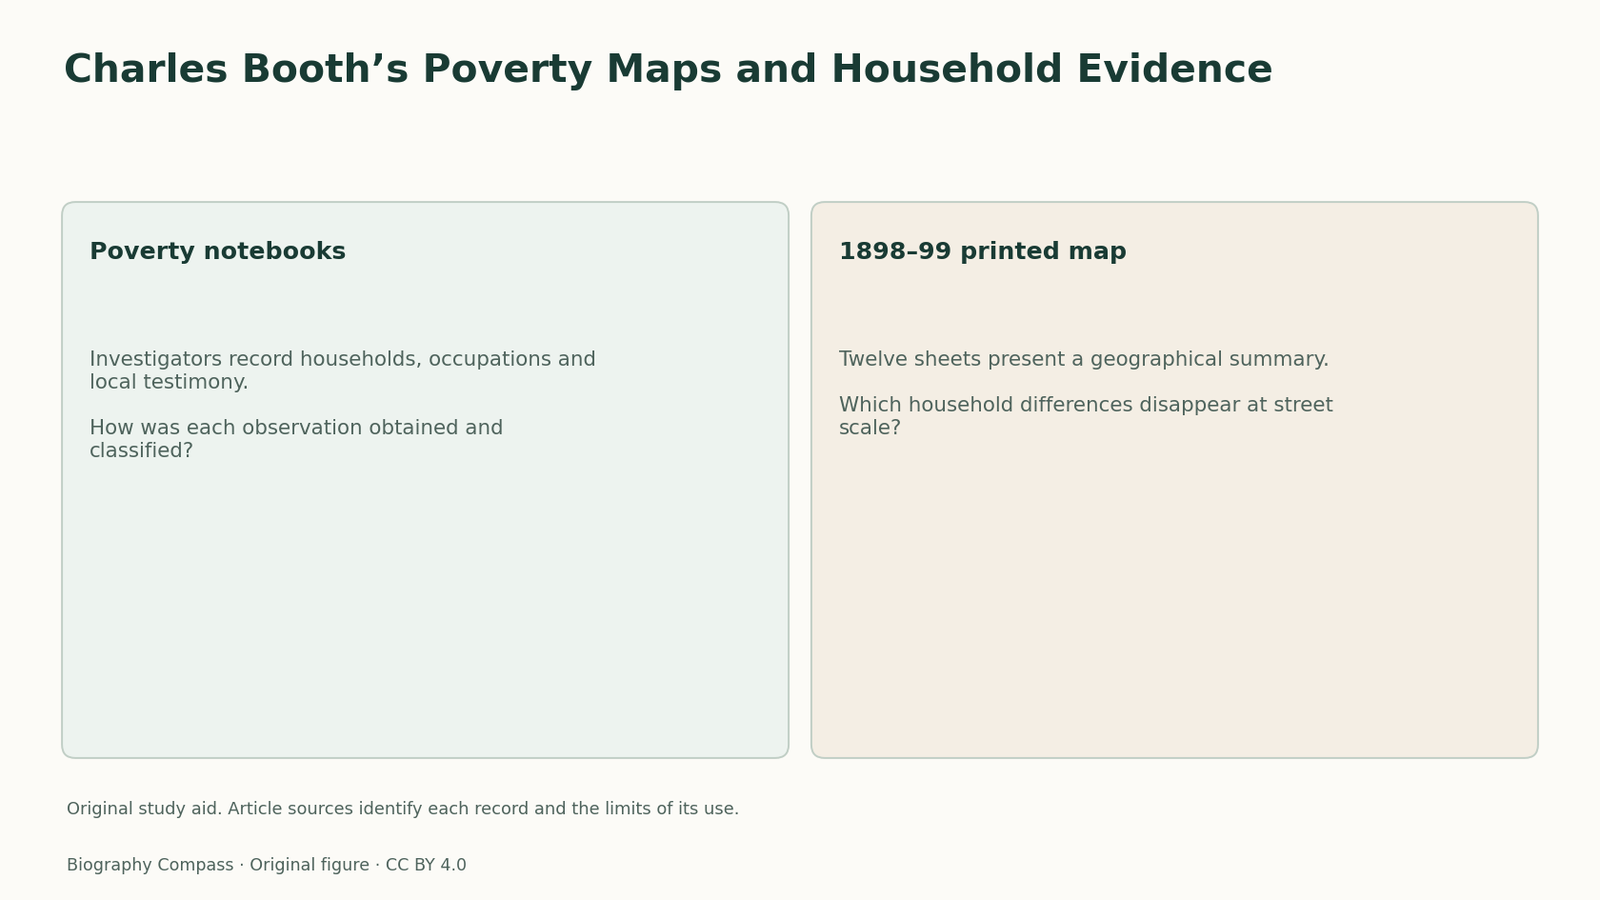
| Poverty notebooks | Investigators record households, occupations and local testimony. | How was each observation obtained and classified? |
| 1898–99 printed map | Twelve sheets present a geographical summary. | Which household differences disappear at street scale? |
Chronology
A timeline of the turning points
Inquiry organised
Booth begins organising the investigation.
Printed map
The poverty map appears in twelve sheets.
Final survey
The extended inquiry reaches its final publication period.
Identify the unit being recorded
The poverty notebooks contain household information, occupations and descriptions of streets. These are related units, but they are not identical. A statement about one household cannot automatically describe every neighbour, and a street classification cannot supply the circumstances of every resident. Before extracting evidence, label whether the entry concerns a person, household, occupation or street. That small step prevents an attractive geographical summary from replacing the scale of the underlying observation.
Sources for this section: [2]
Follow the information’s route
LSE’s account explains that investigators used School Board Visitors’ records and interviews. The information therefore passed through people with particular responsibilities and local perspectives before reaching the survey’s notebooks and publications. This route gives the evidence value while also identifying questions about selection and interpretation. Ask who knew the household, what the visitor was recording and how an investigator translated those details into a category.
Read the map as a published arrangement
The printed map of 1898–99 comprises twelve sheets, distinct from the additional hand-coloured maps preserved in the archive. A reader comparing two images should identify the series and date before interpreting differences. The printed geography summarises classifications across a very large area. Its visual clarity is useful, but the format cannot reproduce every qualification, uncertainty or variation recorded in the investigation’s much more extensive written material.
Sources for this section: [3]
Build a scale comparison
Choose an archival notebook entry and locate its street in the appropriate published sheet. Make three notes: the unit described in the entry, the category assigned on the map and a detail the map leaves out. A strong answer explains the relationship rather than announcing that one medium is more truthful. The exercise can reveal how mapping makes a pattern visible while necessarily compressing the evidence about people living within that pattern.
Continue the chronology
Related history guides
Biography context
Explore United Kingdom through connected lives
Connected biographies
People behind the records
1840–1916
Charles Booth
Social investigator and businessmanBooth organised a large investigation of London that joined household information, occupations and mapped street classifications.Read biographyQuick answers
Common questions
- Does a street’s map classification describe every resident?
- It is a summary classification. Household details and local variation need to be checked in the underlying records.
Primary and institutional sources
How this history was checked
Sources support the chronology and the record comparison. The reading exercise is original. This article was reviewed on 7 November 2026.