
The short answer
A probability calculation can fail even when its arithmetic seems plausible, if an amplitude has been mistaken for a probability. This lesson makes the distinction explicit and then tests the information retained by a single measurement.
Historical record and original analysis
Three mathematical objects
Keep the input, its magnitude and the prediction distinct.
| Object | Value in the example | Interpretive role |
|---|---|---|
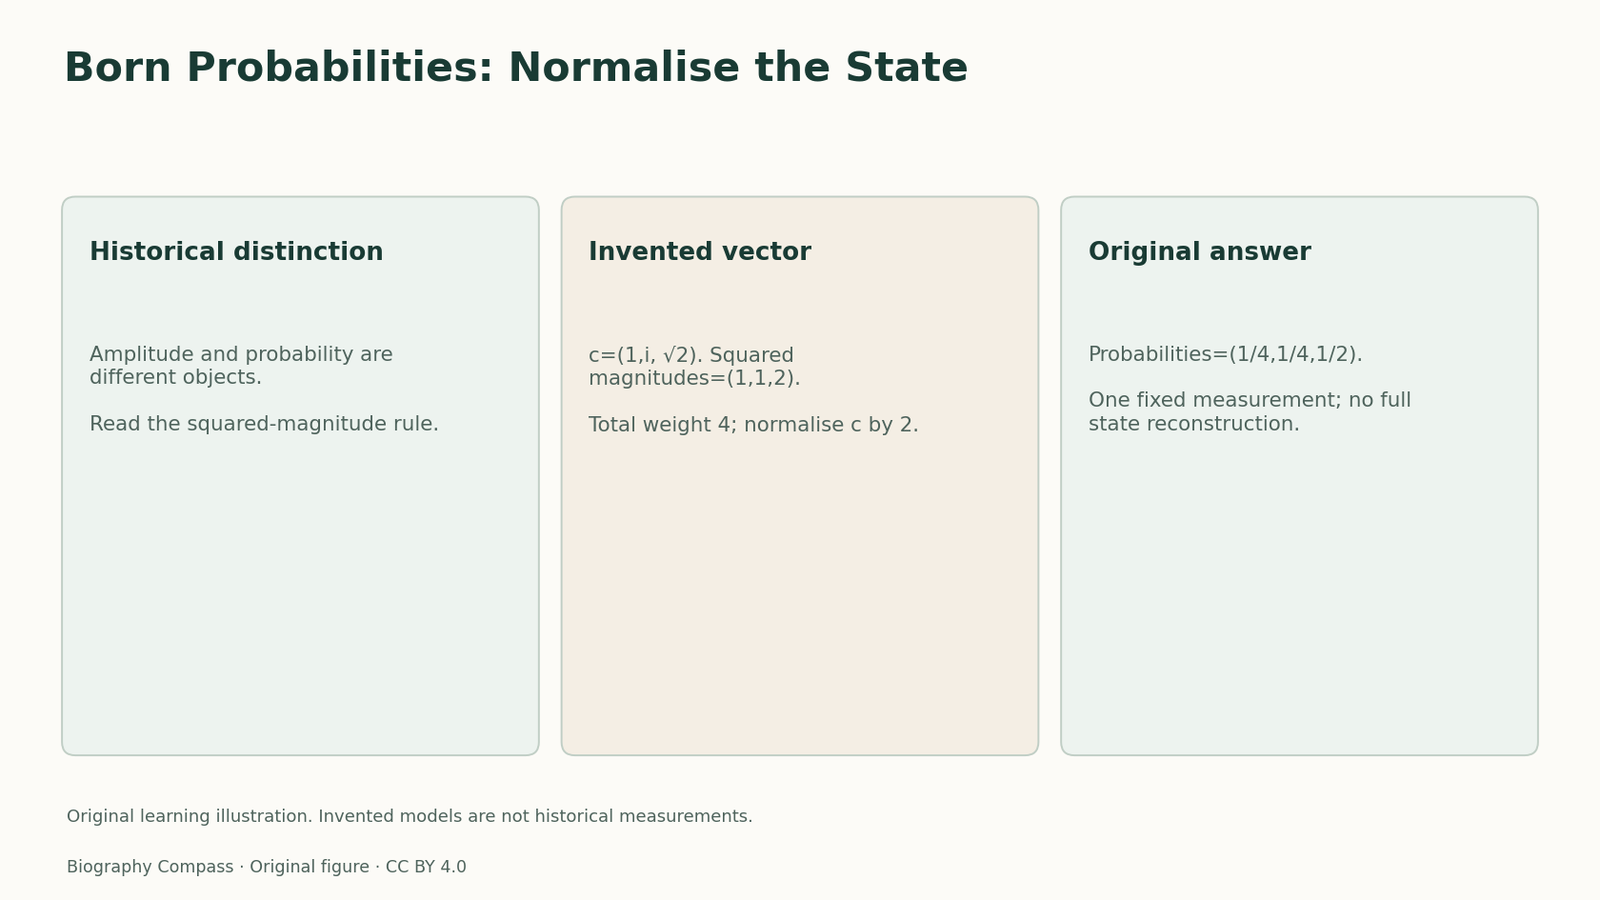
| Coefficient vector | (1,i, √2) | Unnormalised amplitudes. |
| Squared magnitudes | (1,1,2) | Weights with total 4. |
| Probabilities | (1/4,1/4,1/2) | Specified measurement outcomes. |
Chronology
A timeline of the turning points
Earlier work recalled
Statistical interpretation developed.
Lecture
Scattering and discrete states discussed.
A statistical reading of the formalism
Born’s lecture relates squared wave amplitudes to relative scattering probabilities and describes discrete-state probabilities as squared magnitudes of coefficients. It acknowledges collaborators and continuing objections about interpretation.
This changes the kind of claim extracted from the calculation: an amplitude is not itself the predicted frequency of an outcome. The historical text distinguishes agreement about formulae from agreement about interpretation.
Sources for this section: [1]
Define a finite classroom model
Use an invented three-state model with mutually exclusive, exhaustive, orthonormal measurement outcomes. For coefficients c1,c2,c3, apply probability proportional to |c|². Normalise by the sum of all three squared magnitudes. The model is a deliberately finite illustration, not the lecture’s full scattering calculation.
Take the unnormalised coefficients 1,i, √2, where i²=−1. Ask whether the probabilities are 1,i, √2, or whether they are obtained by summing the coefficients and dividing by that sum. Neither shortcut follows the stated rule.
Sources for this section: [1]
Work the example and an information test
Reference answer: the squared magnitudes are 1,1,2 and sum to 4. Divide the coefficient vector by 2 to normalise it. The resulting probabilities are 1/4,1/4,1/2; they are real, non-negative and sum to 1.
In 400 independent repetitions with the same preparation, expected counts are 100,100,200. These are expectations, not a promise that one finite set of observations will exactly match them.
Now replace i with −i. The three squared magnitudes, and therefore this specified measurement’s probabilities, remain unchanged. That demonstrates only that this measurement does not distinguish the two given preparations. It does not establish that relative phase is irrelevant to every possible measurement.
Sources for this section: [1]
Diagnose the limits of the calculation
The original problem specifies its outcome basis, normalisation and repeated-preparation assumptions. Without those choices, a bare list of three numbers is incomplete as a probability model. The exercise tests a consequence of the statistical rule, not a proof of quantum mechanics or a complete reconstruction of a state from one outcome distribution.
Sources for this section: [1]
Continue the chronology
Related history guides
Biography context
Explore United Kingdom through connected lives
Connected biographies
The researcher behind the record
Quick answers
Common questions
- Must the expected counts appear exactly?
- No. Expectations describe the model’s average, not a guaranteed result in one finite set of observations.
- Does the sign-change test discard phase from the theory?
- No. It compares only the stated preparations under the specified measurement.
Primary and institutional sources
How this history was checked
Selected original records are identified below. Invented inputs and calculations are labelled separately from historical observations. This article was reviewed on 31 October 2026.