
The short answer
Seeing a Javan rhinoceros twice does not establish that two rhinos are present. Researchers at Ujung Kulon used identifiable features in photographs and videos to tell individuals apart. They could then ask what patterns of repeat detection implied about the population recorded during a study period.
Interpreting a survey
A detection, an individual and an estimate answer different questions
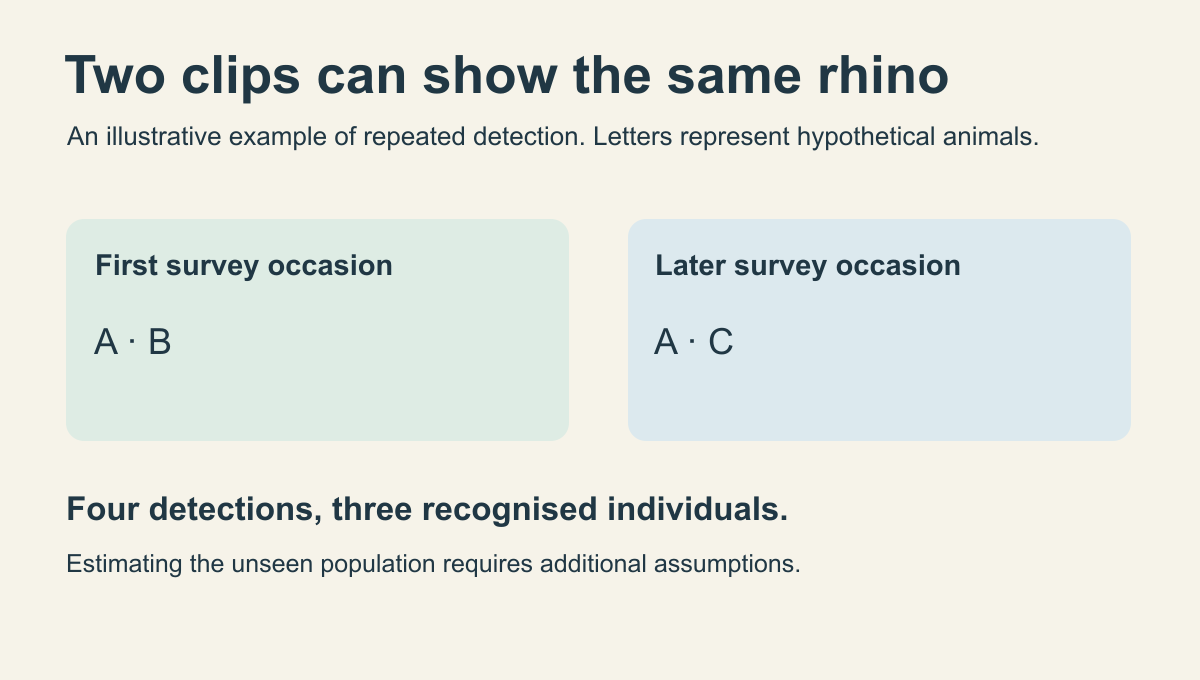
Use the hypothetical example in the illustration to separate these quantities.
| Quantity | What it means | What to check |
|---|---|---|
| Detection | A record in which an animal appears | One animal can appear in several recordings. |
| Recognised individual | A distinct animal judged to match or differ from other recordings | Identification depends on visible features and a usable view. |
| Population estimate | A model-based inference from the encounter histories | Look for assumptions about detection, sampling period and uncertainty. |
Chronology
A timeline of the turning points
Ujung Kulon is inscribed
The UNESCO listing recognises habitat important for conserving the Javan rhino.
A study describes camera-based identification
Researchers use repeated detections to examine the population during the study period.
A separate assessment examines population viability
The report uses monitoring information in scenarios about future risks.
Why the researchers compared animals across recordings
A camera records an occurrence. The same rhino can move into view on several occasions. The 2011 study describes using visible differences between animals and matching footage thought to show the same individual. That process turns an archive of clips into histories of when particular animals were detected.
The illustration shows the consequence. Animal A appears twice. Four detections supply evidence of three identified animals. The example says nothing about animals that were never detected.
Sources for this section: [1]
What a repeat-detection analysis can add
If some identified animals turn up often and others rarely, the pattern carries information about detectability. Mark–recapture analysis uses first and repeated encounters to infer quantities that a simple clip count cannot supply. In this case the researchers used natural identifiable features rather than adding a new mark to every animal.
A reader should compare the definitions and study period before placing two population figures on the same chart. An identified-animal tally, a statistical estimate and a later planning input describe different things.
How the 2015 assessment used earlier monitoring
A viability assessment asks how a population might fare under specified risks and assumptions. Camera records provide evidence about a period that has already occurred. Later simulation uses such evidence as input. Read the assessment for its scenarios and the underlying study for the observations from which it draws.
Continue the chronology
Related history guides
Connected biographies
People connected to this history
Quick answers
Common questions
- Why did the researchers count identifiable animals instead of clips?
- One rhino can appear more than once. Individual identification helps distinguish repeated sightings from different animals.
- Can one camera survey give an exact census?
- The survey records animals it detects. Population estimates use additional assumptions about detection and should be read with their uncertainty.
Primary and institutional sources
How this history was checked
Dates, legal milestones and historical claims are checked against the official and institutional records below. This article was reviewed on 19 November 2026.
- Adhi R. S. Hariyadi and colleagues, PachydermVideo and camera-trap estimates of Javan rhino population structure
- IUCN conservation planning specialists and workshop partners2015 population and habitat viability assessment for the Javan rhino
- UNESCO World Heritage CentreUjung Kulon National Park property record