
The short answer
Why did the change of a liquid resonance identify evidence the pressure record could not localize?
Read the evidence
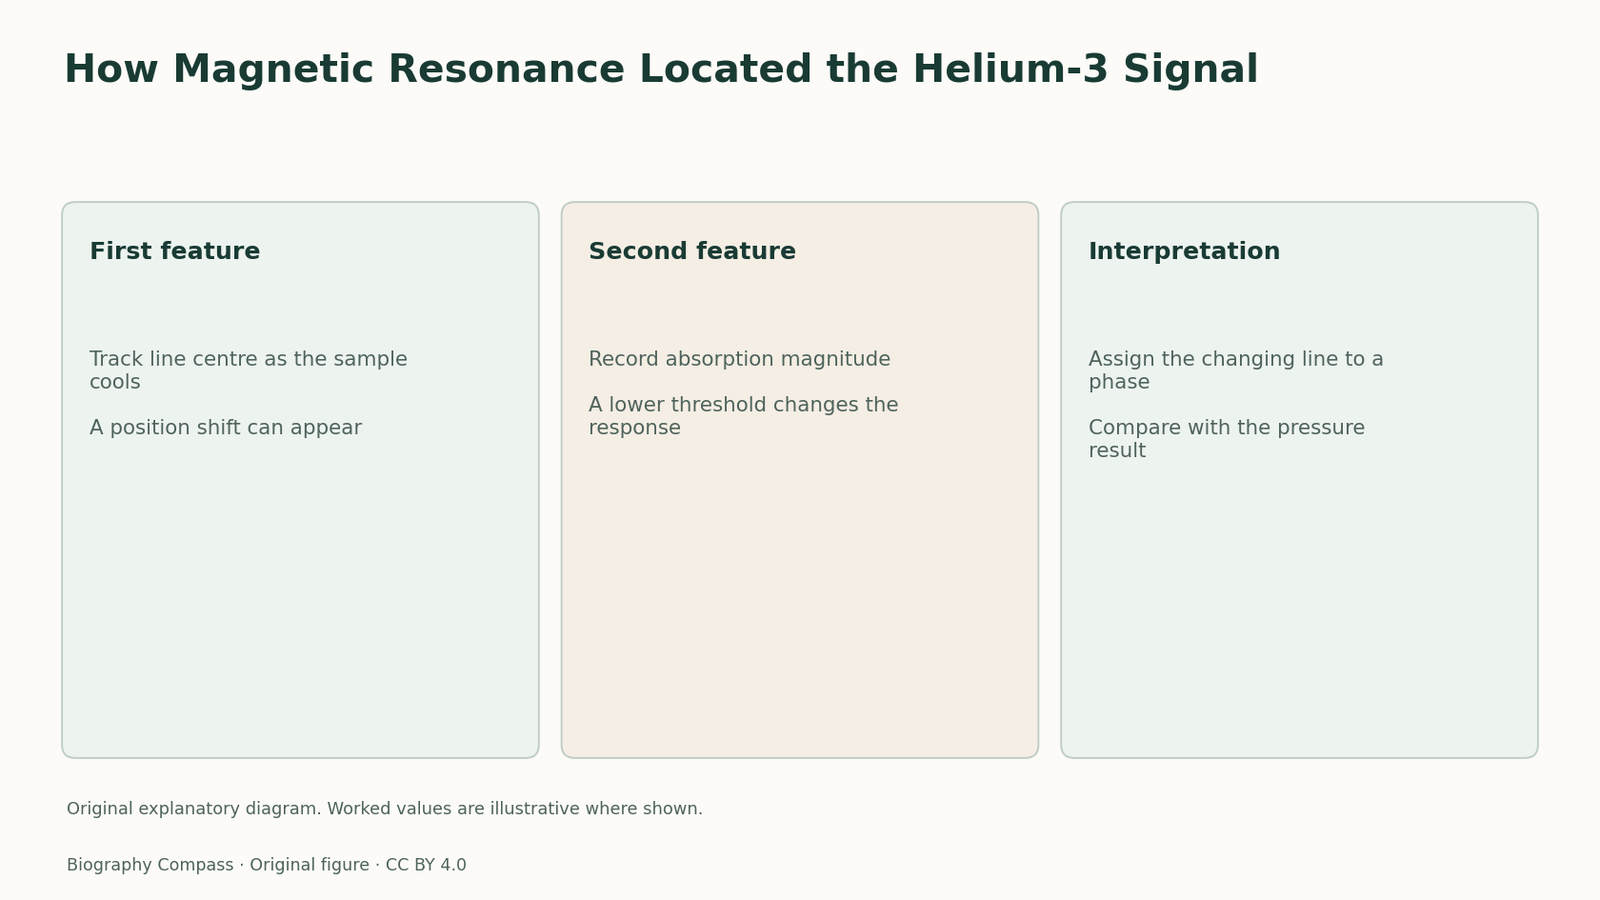
Read a line’s position and absorption separately
The observations carried several pieces of information even within the same measurement method.
| Feature | What to compare | What it can tell us |
|---|---|---|
| Frequency position | Line centre at neighbouring temperatures | A changing resonance condition |
| Absorption strength | Magnitude of response around the line | A distinct change in magnetic behaviour |
| Component assignment | Line associated with the liquid | Which phase carries the signal |
Follow a line rather than one thermometer
Magnetic resonance measures a response to a varying magnetic field. A recognizable line has a position in frequency and an absorption strength. Those properties can be tracked as temperature changes. In the Cornell sample, a line associated with the liquid showed unusual behaviour at low temperature. Because the liquid contribution could be distinguished from other parts of the response, the line provided evidence about where the change occurred. This is a different contribution from a measurement whose value is shared by the coexisting phases. The new result gave a way to assign changes to the liquid itself.
Two signatures across the low-temperature interval
The October 1972 abstract reports that below roughly 2.7 millikelvin the line associated with liquid helium-3 shifts to higher frequency as the sample cools. At a lower threshold near 2 millikelvin the reported frequency shift disappears and the absorption magnitude falls abruptly to approximately half of its previous value. The numbers describe the observations under the reported conditions. They should not be taken as universal transition temperatures for every pressure or field. The distinctive point is that the later observation contains two kinds of behaviour, frequency displacement and a change of absorption.
Sources for this section: [2]
An invented spectrum comparison
Imagine a trace with a line centred at 100 arbitrary frequency units and an absorption strength of 8. A second trace has its centre at 105 and the same strength. A third has its centre back at 100 but its strength is now 4. Calling all three changes simply stronger or weaker would discard the first difference. The invented values show why the position of a line and the strength of a line must be recorded separately. Whether a change is abrupt or gradual also requires observations across several intermediate temperatures, rather than only comparing two endpoints.
Sources for this section: [2]
Connect the line to the sample
The historical argument relies on associating the changing line with the liquid component. If that assignment were mistaken, tracking the line would not settle which phase changed. The publication accordingly connects its magnetic findings to the earlier pressure effects and to the part of the sample responsible for the response. Those connections make the work evidentiary rather than just descriptive. They show why a new observable can be more decisive than a more precise reading of the old one, provided that the new signal is linked to the phase it is intended to represent.
Do not collapse both papers into one observation
A pressure anomaly can be real even if its first attribution is mistaken. The later magnetic study clarified that attribution and supplied new features worth explaining in their own right. In a reading of the 1972 papers, identify the observable in each report, the inferred source of the signal and the evidence that connects the two. The April report supplies a shared pressure signal and a provisional interpretation. The October report supplies a phase-associated magnetic signal and a reason to change that interpretation. It also names an additional coauthor whose role should remain visible in the discovery’s history.
Continue the chronology
Related history guides
The Pressure Clues to Superfluid Helium-3
Read the first Cornell pressure anomalies and the distinct measurements that reassigned them to liquid helium-3, with an example of a changed inference.
Read the timeline1970sHow Compression Can Cool Helium-3
Compare the entropy of liquid and solid helium-3, then use a simplified insulated-cell example to see why changing phase can lower temperature.
Read the timeline1912How Pressure Changes Which Ice Phase Is Stable
Read Bridgman’s 1912 water study in context, with an original free-energy comparison showing why pressure can favour a different solid structure.
Read the timelineBiography context
Explore United States through connected lives
Connected biographies
Researchers and collaborators
1945–
Douglas Osheroff
Experimental physicist of quantum fluidsRead Douglas Osheroff’s path from Caltech to Cornell, Bell Laboratories and Stanford, including how he used magnetic resonance to probe helium-3.Read biography1931–
David Lee
Experimental physicist of low temperaturesFollow David M. Lee from Harvard and Yale to Cornell, where he collaborated with Robert Richardson and Douglas Osheroff on low-temperature helium-3.Read biography1937–2013
Robert C. Richardson
Low-temperature experimental physicistFollow Robert C. Richardson’s training under Horst Meyer and his collaboration at Cornell with David Lee and Douglas Osheroff on superfluid helium-3.Read biographyQuick answers
Common questions
- What did the low-temperature response do?
- The liquid-associated line shifted, then its shift disappeared at a lower temperature as absorption dropped.
- Are line position and strength interchangeable?
- They are separate measured properties and can change independently.
Primary and institutional sources
How this history was checked
Dates, legal milestones and historical claims are checked against the official and institutional records below. This article was reviewed on 13 November 2026.