
The short answer
Why could a column in radiative balance still require vertical heat transport?
Read the evidence
Conditions of the atmospheric calculation
Both humidity rules can start from the same temperature and water content.
| Quantity | Model constraint | Reading the result |
|---|---|---|
| Relative humidity | Fraction of saturation stays specified | Vapour amount can change with temperature |
| Absolute humidity | Vapour amount stays specified | Relative humidity can change |
| Convective adjustment | Unstable gradients are adjusted | Vertical heat redistribution affects equilibrium |
What equilibrium has to explain
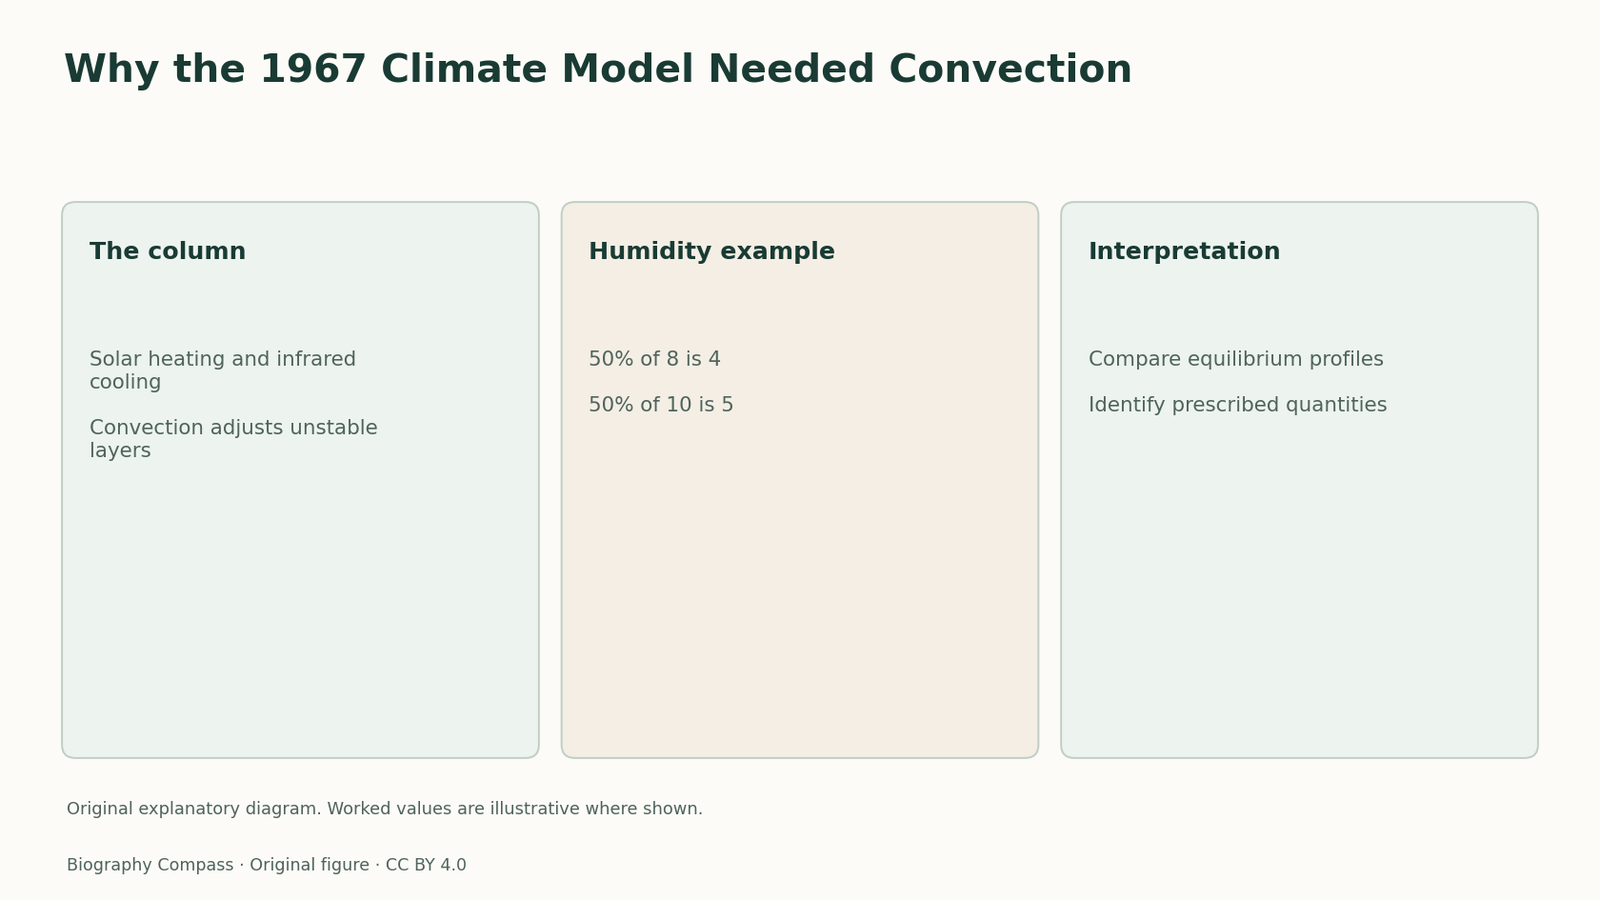
A column model needs a rule for exchanging energy between the surface, layers of air and space. Solar absorption supplies energy and infrared emission removes it. A temperature profile that satisfies a radiation calculation can still become unstable if its temperature drops too sharply with height. Rising air can then remain warmer than its surroundings and redistribute heat. Manabe and Wetherald calculated equilibrium by letting a model column adjust with time. That approach makes the target a vertical structure maintained by radiative processes together with redistribution in unstable parts of the column.
The distinction between two humidity assumptions
In the 1967 study, one case prescribed relative humidity and another prescribed absolute humidity. Relative humidity is the fraction of saturation at a given temperature. If that fraction stays fixed as temperature increases, the amount of water vapour can rise. Under fixed absolute humidity, that change is suppressed by construction. The authors reported a larger temperature response in the first case. Their comparison is useful because the differing responses follow from what the model lets water vapour do. An experimental contrast has been built into the assumptions before the numerical integration starts.
A scale check with invented values
Suppose saturation in a classroom example is represented by 8 units in a cooler layer and 10 units after warming. At 50 percent relative humidity, actual vapour is initially 4 units and increases to 5. Holding it at 4 instead would lower relative humidity to 40 percent. Both rules begin from the same state but produce different later states. The arithmetic is only a comparison of assumptions, not a calculation of vapour at any real altitude. It also gives no direct temperature prediction because the radiative response requires the rest of the model.
Read the doubling result in context
The authors estimated approximately two degrees of surface warming for doubled carbon dioxide in their fixed relative humidity calculation. The estimate concerns their equilibrated model under its specified treatment of the column. An adjustment from one equilibrium to another has no map, storm sequence or ocean heat uptake history attached to it. Even the distinction between equilibrium and transient warming needs a specified time evolution and energy storage. The later coupled ocean–atmosphere publications in Manabe’s bibliography give a reader a way to locate those related but separate questions.
What convection adds to the interpretation
The title’s thermal equilibrium is an endpoint of adjustment. The model cannot be understood by changing carbon dioxide and reading off an infrared opacity alone. A vertical profile links changes at several levels, and allowing unstable gradients to adjust changes where the heat balance is maintained. To audit a claim about such a model, write down the changed input, the rule for humidity, the rule for convection and the quantity actually read from the final solution. Those four items prevent a conditional column result from being treated as an unconditional regional forecast.
Continue the chronology
Related history guides
How COBE DMR Measured Differences in the Sky
Read the first-year COBE maps, compare two independent receiver channels, and see how smoothing and Galactic masks qualify the reported sky signal.
Read the timeline1970Peebles and Yu’s 1970 Cosmic Sound Model
Examine the Peebles–Yu calculation across recombination, how photon transport changes a spectrum, and why resolution matters for temperature fluctuations.
Read the timelineBiography context
Explore United States through connected lives
Connected biographies
Researchers and collaborators
1931–
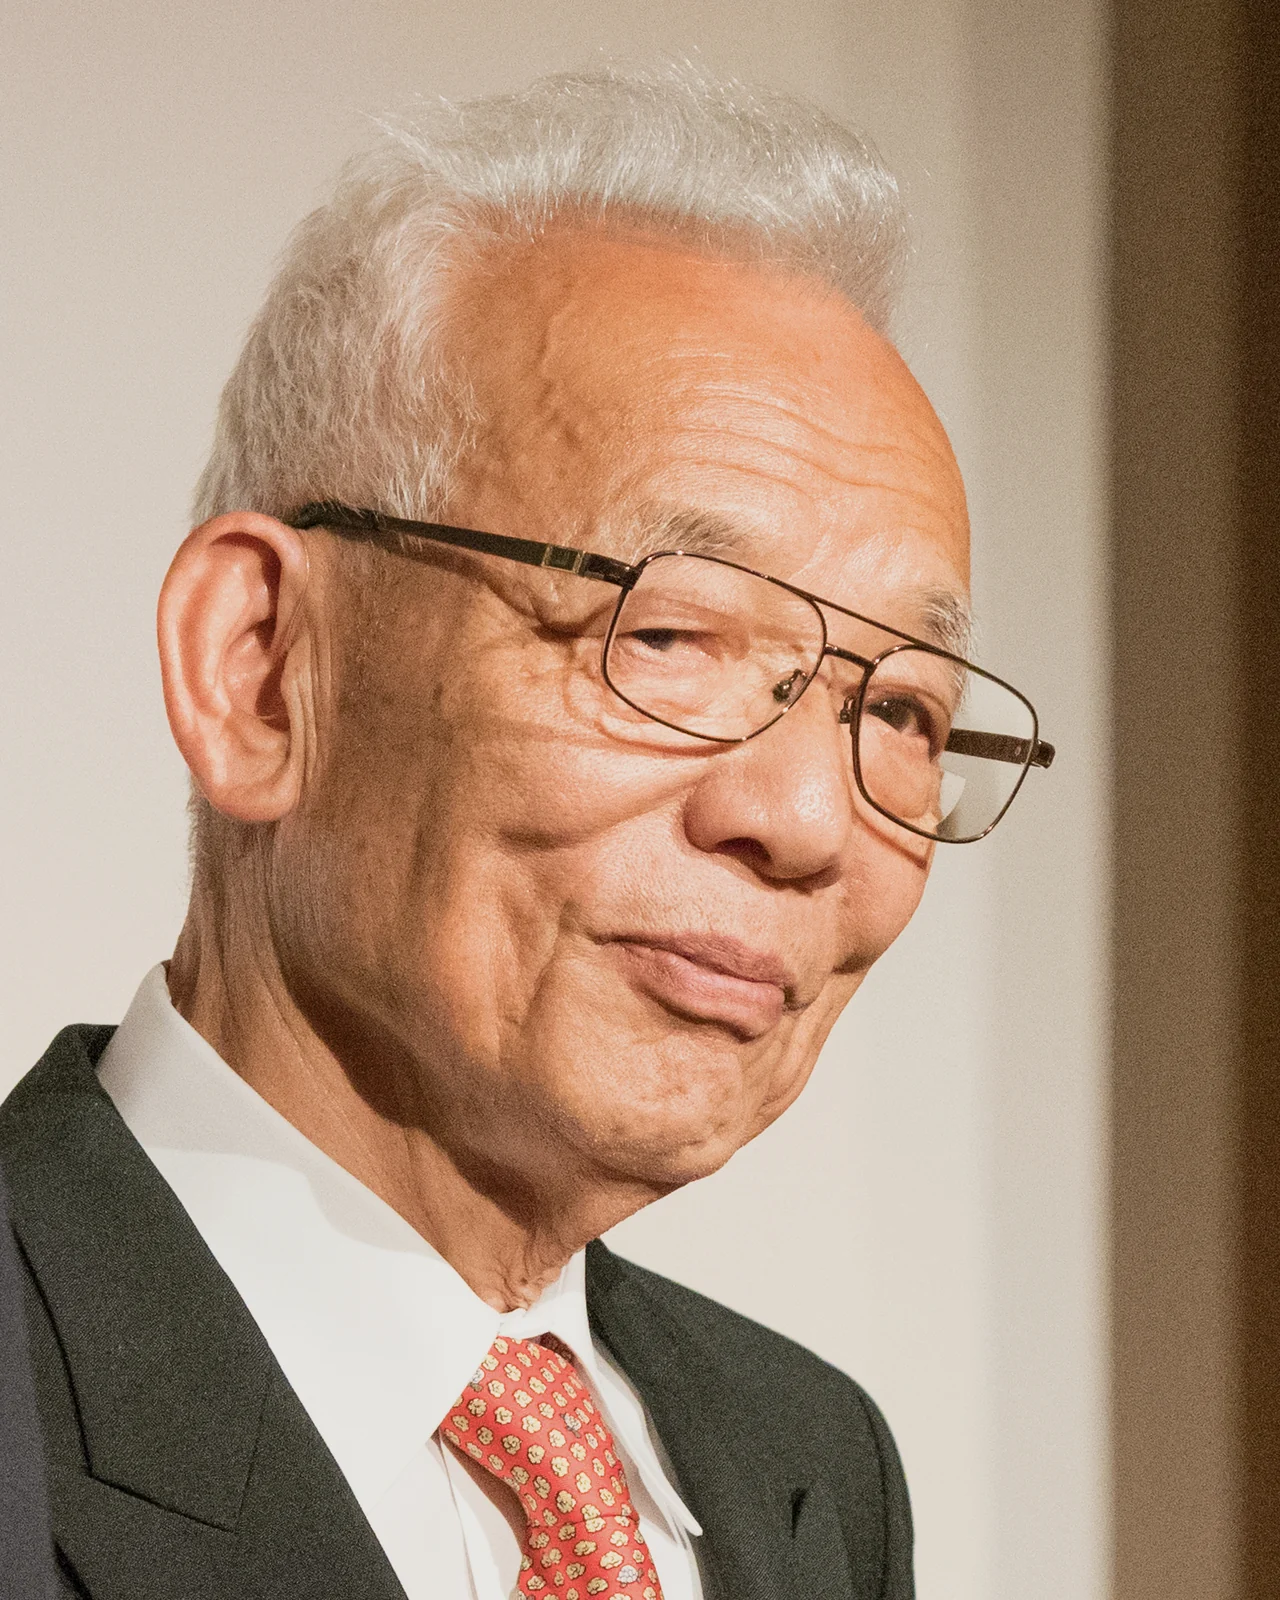
Syukuro Manabe
Meteorologist and climate modellerFollow Syukuro Manabe from Shikoku to the Weather Bureau and Princeton through his work with Richard Wetherald, Joseph Smagorinsky and Kirk Bryan.Read biography1946–
John C. Mather
Astrophysicist and space-instrument scientistExplore John Mather’s education, COBE teamwork and later telescope work, separating the 1990 background spectrum from maps of sky anisotropy.Read biographyQuick answers
Common questions
- Why compare two humidity rules?
- They reveal how the permitted water-vapour response affects thermal sensitivity.
- Does the column describe regional weather?
- It calculates vertical equilibrium under specified assumptions. Regional circulation and transient change require other model components.
Primary and institutional sources
How this history was checked
Dates, legal milestones and historical claims are checked against the official and institutional records below. This article was reviewed on 13 November 2026.