
The short answer
A numerator becomes interpretable only after its unit and observation window are specified. This study reads a concrete trial definition, then uses fictional cohorts to separate people from follow-up time.
Record comparison
The units prevent substitution
Keep the historical record distinct from the stipulated model.
| Question | Record or stipulated input | Consequence and limit |
|---|---|---|
| Risk-like proportion | 10 affected people/100 participants | 10% in both invented groups. |
| First-event rate | 10 events/50 or 100 person-years | Different rates despite equal counts. |
| Recurrent events | A different numerator and exposure ledger | Cannot silently reuse first-event follow-up. |
Chronology
A timeline of the turning points
Trial report
The selected analysis definitions were published.
The report defines its comparison
The selected 2014 report distinguishes per-protocol and intention-to-treat populations. Its efficacy calculation compares first-event rates using person-time, counting only each participant’s first qualifying event and ending that participant’s relevant follow-up at the event or another endpoint.
These definitions prevent an affected-person count from being silently substituted for all episodes. They also explain why a comparison of proportions and one of event rates can answer different questions. No current clinical recommendation follows from this historical analysis definition.
Sources for this section: [1]
An invented follow-up ledger
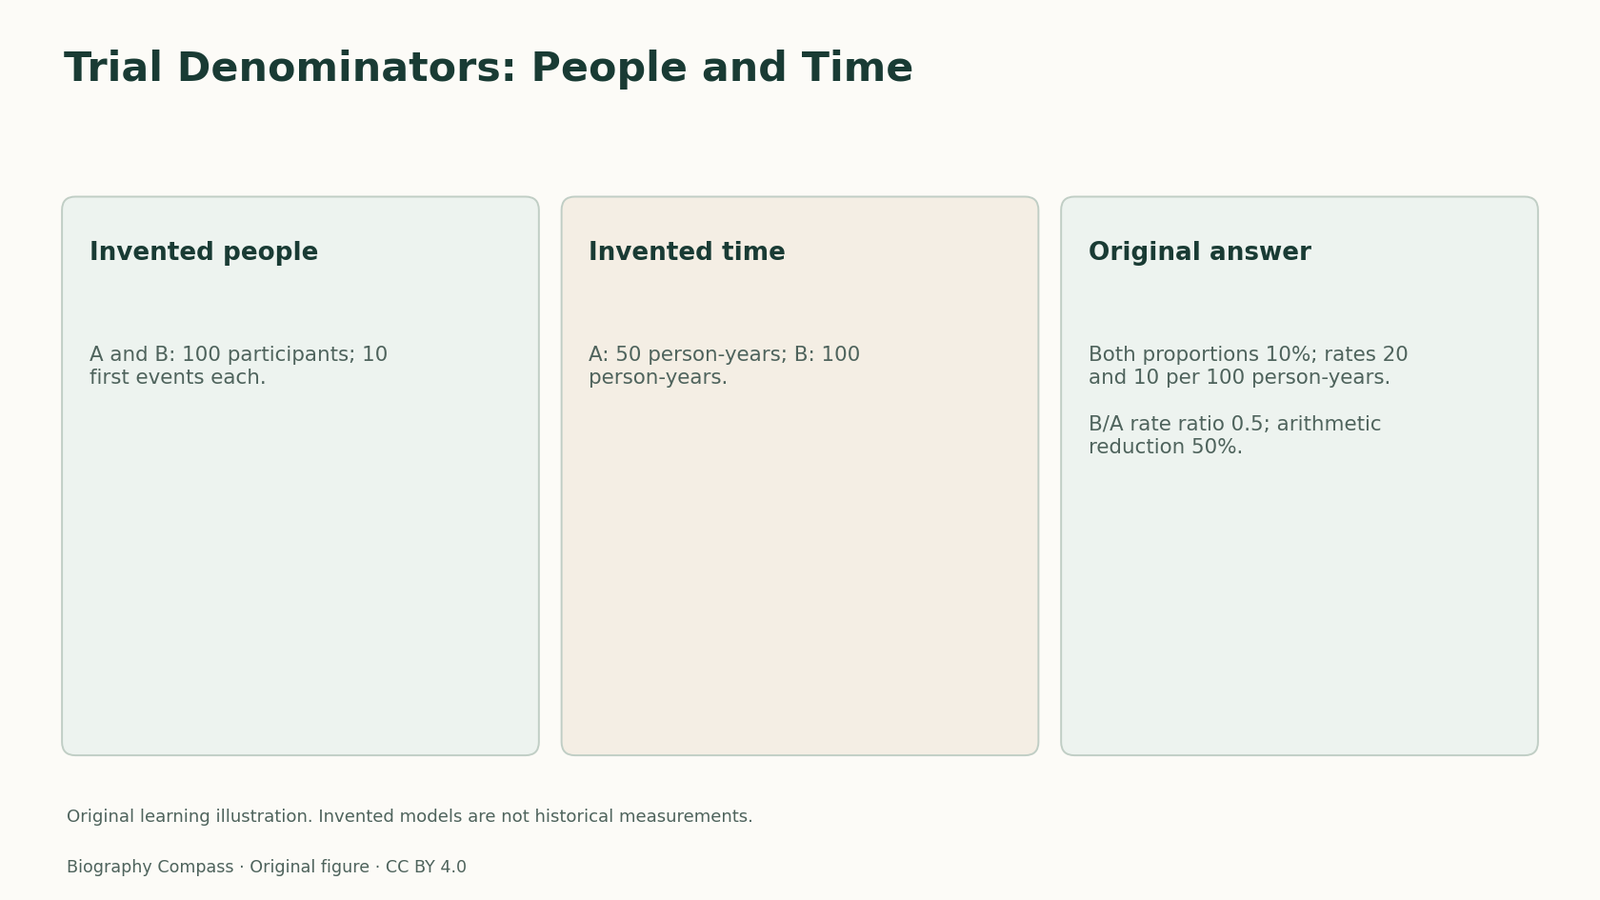
Invent two nonclinical observation groups, each with 100 participants and 10 first events. Group A contributes 50 person-years before its first-event or censoring endpoints; group B contributes 100 person-years. Assume complete event ascertainment and treat the supplied totals as exact.
Compute the affected-person proportion in each group, the first-event rate per 100 person-years, and the relative rate reduction of B compared with A. Then ask whether the same quantities can be obtained from ten affected people alone without the follow-up totals.
Sources for this section: [1]
Reference answer
Both proportions are 10/100=10%. The rates are 10/50×100=20 and 10/100×100=10 per 100 person-years. The B-to-A rate ratio is 0.5, giving an arithmetic relative rate reduction of 50%. The equal proportions do not remove the difference in accumulated observation time.
Now invent 5 additional recurrent events among the same affected people. The first-event numerator remains 10. An all-episode numerator would be 15 and would require a consistently defined all-episode observation period. Dividing 15 by the original first-event person-time would mix incompatible definitions.
Sources for this section: [1]
Selection and uncertainty remain
The arithmetic is not a causal inference about a treatment. The fixture supplies neither a randomisation process nor uncertainty intervals, competing-event information or follow-up distributions. It is an accounting exercise.
The historical report’s named populations and event rules make its result a defined comparison. A reader should preserve those rules when discussing a published percentage, instead of treating that percentage as a timeless property applying to every person and period.
Sources for this section: [1]
Continue the chronology
Related history guides
Biography context
Explore India through connected lives
Connected biographies
The working life behind the record
Quick answers
Common questions
- Is the 50% answer a vaccine-effectiveness estimate?
- No. It is an invented nonclinical rate comparison.
- Does a person-year mean one person was followed for exactly one year?
- No. It is accumulated observation time; many individual follow-up patterns can produce the same total.
Primary and institutional sources
How this history was checked
Selected records support the historical discussion. Invented inputs and original answers are labelled; no complete uninspected work is claimed. This article was reviewed on 31 October 2026.