The short answer
A satellite can show where vegetation changed after fire. In peatlands, carbon may also be released when the soil itself burns. The study of Indonesia’s 1997 fires combined satellite mapping with ground measurements of how much peat was lost. It then explored how those local observations might scale to the country.
Reading the records
How an area map became a carbon estimate
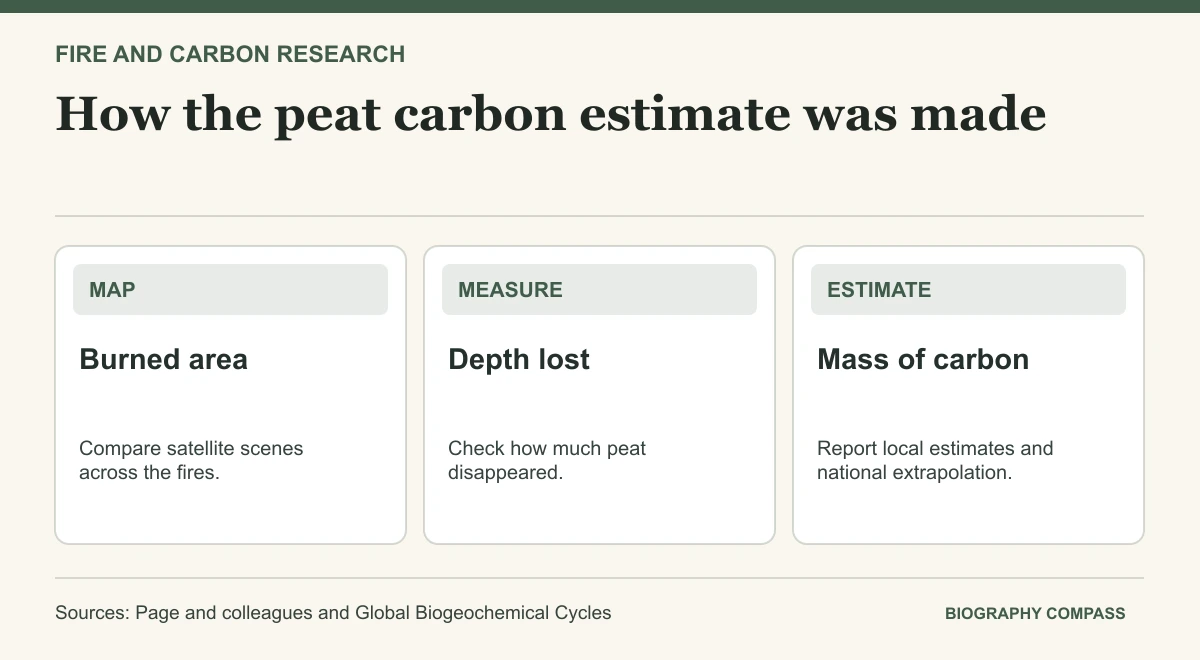
Area, depth and carbon content together determine how much peat carbon the model assigns to a fire.
| Step | Evidence | Role |
|---|---|---|
| Area | Satellite comparison | Maps the part of the study region that burned. |
| Depth | Ground measurements | Estimates the thickness of peat removed. |
| Carbon | Density and carbon assumptions | Converts the peat volume into a carbon mass. |
| Extrapolation | National burned-area scenarios | Produces a range across assumptions. |
Chronology
A timeline of the turning points
Fires during El Niño conditions
Peat and surface vegetation burned in the study region.
Burned areas mapped
Landsat scenes allowed researchers to assess change.
Carbon estimates published
The paper reported a local estimate and a much wider extrapolated national range.
Start with the study area
Page and colleagues studied about 2.5 million hectares in Central Kalimantan. They compared imagery acquired before and after the fires to estimate what burned. They then used measured burn depth to estimate how much peat was removed. Some ground outside the region could behave differently, so the study area and the national estimate should retain their own labels.
Sources for this section: [1]
Surface vegetation and soil both matter
The authors estimated that 0.19–0.23 gigatonnes of carbon came from peat combustion within the study area. They estimated a further contribution from vegetation. The quantities are expressed as mass of carbon. They should not be copied as tonnes of carbon dioxide or as an estimate of the smoke people inhaled. Other studies examined fire damage or uncertainty using different combinations of field and satellite evidence.
The range reflects a step beyond direct observations
The paper’s 0.81–2.57 gigatonne national range includes peat and surface vegetation and depends on alternative assumptions for burned land and peat loss. The broader range reports an extrapolation, not additional ground measurements across all of Indonesia. Compare scenarios with their assumptions intact when using this study alongside a later emissions estimate.
Continue the chronology
Related history guides
Connected biographies
People in this history
Quick answers
Common questions
- Why did the study need field measurements?
- Satellite mapping provided an area. Burn depth was needed to estimate how much peat that area lost.
- What does 0.81–2.57 gigatonnes refer to?
- It is the authors’ extrapolated national estimate of carbon from burning peat and vegetation in 1997.
Primary and institutional sources
How this history was checked
Dates, legal milestones and historical claims are checked against the official and institutional records below. This article was reviewed on 19 November 2026.