
The short answer
A cell can be rare in a preparation and have a pronounced effect in a particular assay. The two records measure different features.
Evidence at a glance
What did the functional study add to the original description?
Read each observation alongside the particular inference it supports.
| Record or example | Observation | Interpretation |
|---|---|---|
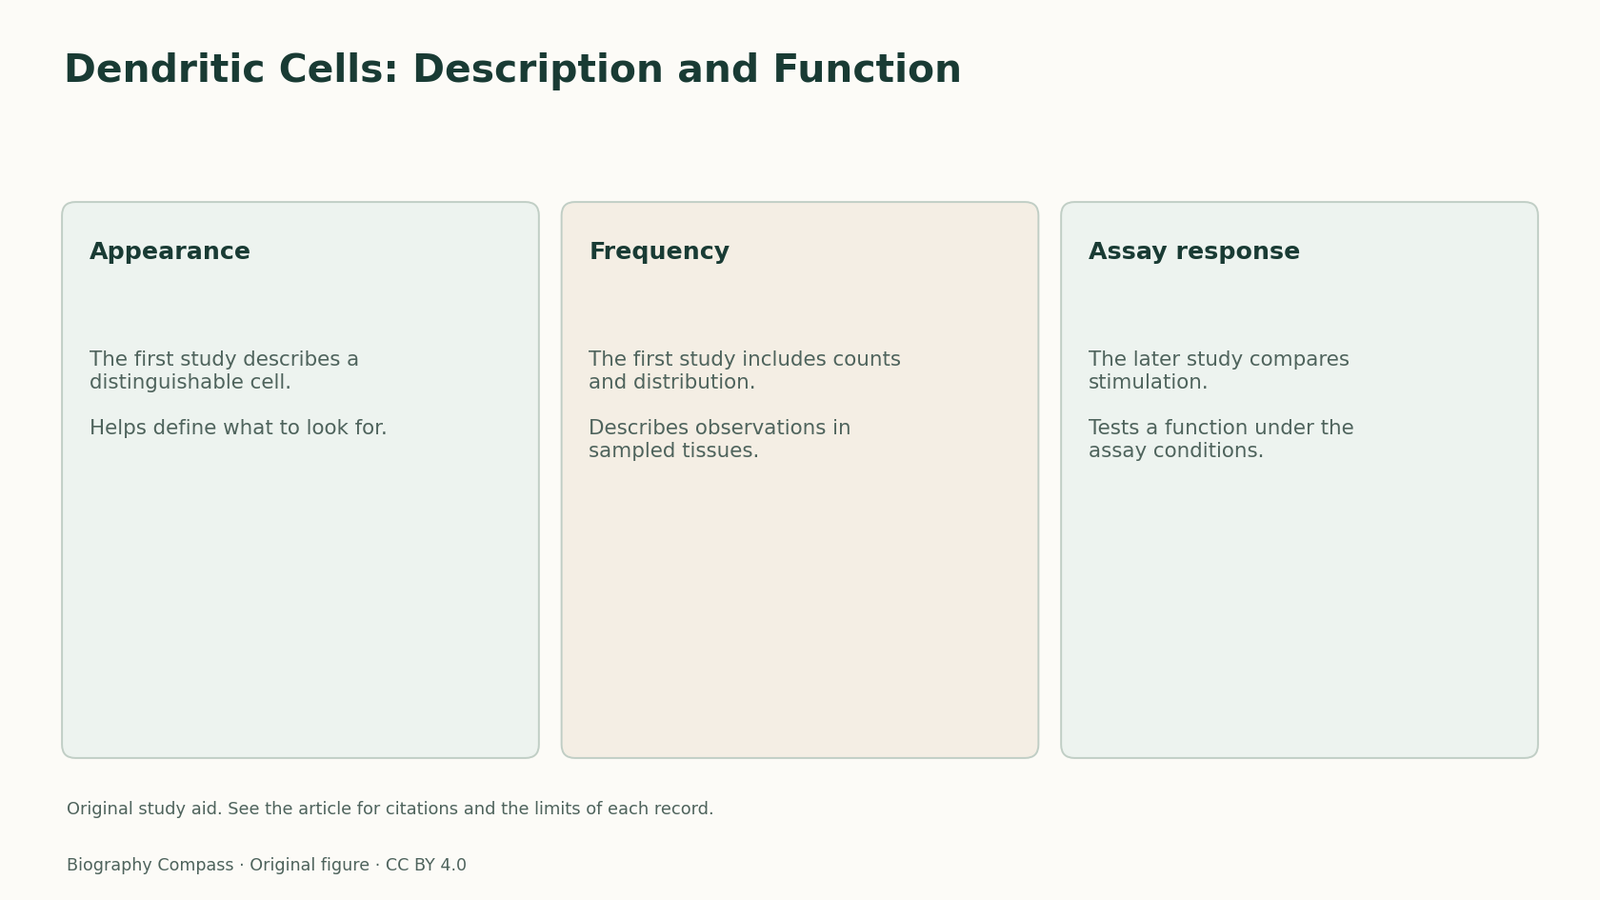
| Appearance | The first study describes a distinguishable cell. | Helps define what to look for. |
| Frequency | The first study includes counts and distribution. | Describes observations in sampled tissues. |
| Assay response | The later study compares stimulation. | Tests a function under the assay conditions. |
The 1973 paper gives a cell description
The paper by Steinman and Cohn separates a newly described cell type from other cells found in mouse lymphoid organs. Its title identifies three sorts of observation: morphology, quantitation and tissue distribution. That framework lets readers distinguish features used to recognize the cell, how often it appeared in studied preparations and where the investigators found it.
Sources for this section: [1]
The 1978 paper changes the outcome
The later study by Steinman and Witmer concerns stimulation of a mixed leukocyte reaction. An assay measuring an immune response adds a functional comparison to the earlier morphological one. A reader can ask which cells were included, how the groups were compared and which response was recorded. That reading avoids treating a shape or count as sufficient to infer the outcome of an assay.
An original frequency and response exercise
Imagine two cell groups in a simplified paper exercise. X makes up two of every hundred cells in one sample; Y accounts for forty. When equal numbers of X and Y are compared in a model assay, X gives the larger response. Which group is more frequent in the sample? Y. Which gives the larger response under the stated assay comparison? X. These values are invented and reproduce no historical counts.
A useful question for later records
A sample count and a functional comparison can both be reliable while answering different questions. To move from the invented assay to the behavior of a whole tissue, ask about location, interactions, and which conditions alter the response. The Nobel background summarizes later evidence about adaptive immunity. The early papers remain valuable because they allow readers to see which comparison came from which experiment.
Continue the chronology
Related history guides
Biography context
Explore Canada through connected lives
Connected biographies
The researcher behind the records
1943–2011
Ralph Steinman
Immunologist and physicianSteinman and collaborators distinguished a new cell type in lymphoid tissue.Read biographyQuick answers
Common questions
- Does a rare cell necessarily make a small contribution to a response?
- A count does not establish activity. The equal-number example separates frequency from a measured response.
Primary and institutional sources
How this history was checked
The notes distinguish period evidence, later interpretation, and original exercises. This article was reviewed on 5 November 2026.
- Ralph M. Steinman and Zanvil A. Cohn, Journal of Experimental Medicine, 1973Identification of a novel cell type in peripheral lymphoid organs of mice
- Ralph M. Steinman and Margit D. Witmer, PNAS, 1978Lymphoid dendritic cells are potent stimulators of the primary mixed leukocyte reaction in mice
- Nobel AssemblyThe Nobel Prize in Physiology or Medicine 2011: Advanced information