
The short answer
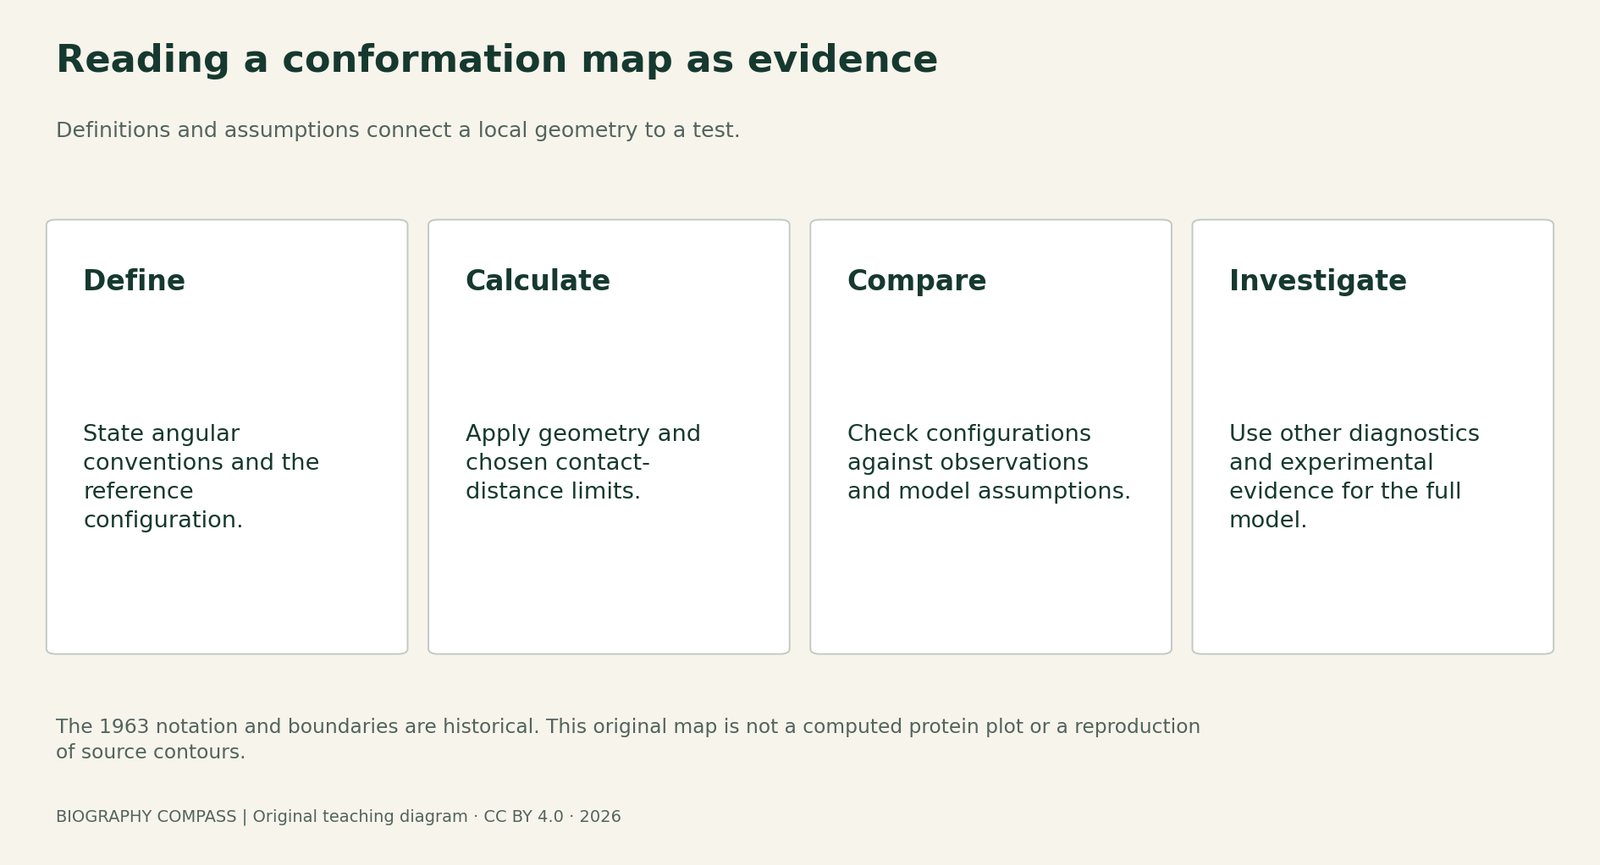
A protein-conformation plot is useful because geometry constrains possible structures. Its historical paper is equally useful for showing how definitions, assumptions and comparisons make that constraint testable.
Original source-reading aid
Match the claim to the evidence
A record can establish one stage of the story without proving every later claim.
| Country | Evidence it supplies | Limit |
|---|---|---|
| Angular convention | How a local conformation is represented. | A number cannot be moved between conventions without checking definitions. |
| Contact-distance assumptions | The rules used to calculate regions. | Not an assumption-free universal drawing. |
| Known structures | A comparison with previously studied configurations. | Not a newly measured database produced by this guide. |
| Later validation | Several complementary checks on a model. | A good local score does not prove every aspect of the whole structure. |
Start with three authors and two dates
The letter in Journal of Molecular Biology 7, pages 95–99, names G. N. Ramachandran, C. Ramakrishnan and V. Sasisekharan at the University of Madras. Its received date is 27 December 1962;the publication belongs to 1963. That separates a manuscript milestone from a publication year. The IISER Pune museum also describes the calculations and collaboration behind the map. Using the three-author credit makes the research process more precise than assigning every observation and calculation to the scientist whose surname became its familiar name.
An angular description needs a stated convention
The original text describes rotation around bonds joining neighbouring peptide groups and labels its two parametersφ and φ′. The scanned figure uses 0–360-degreeaxes. A modern diagram often usesφ and ψ with signed angles. Before comparing numerical locations, read the definitions and reference configuration. A point should not be transferred from one chart to another merely because the two pictures resemble one another. This guide does not supply an unverified conversion formula or reuse the original figure as if it were a new calculation.
Sources for this section: [1]
Permitted regions depend on the model’s assumptions
The authors used peptide-group geometry and alternative minimum contact distances to examine close approaches between atoms. The paper distinguishes an inner permitted region from an outer limit and discusses how changing a bond-angle assumption alters the map. These are part of the method, not inconvenient details to remove from the story. The museum’s account places this reasoning in earlier debate about collagen geometry. A map’s value comes from making a physical constraint examinable under specified assumptions.
Model checking developed beyond one historical diagram
The 2010 MolProbity abstract describes a validation service combining all-atom contacts with geometry and torsion-angle criteria. That supplies a useful later contrast: conformation is one check among several. A location outside a chosen reference region is a reason to investigate a model, not by itself a complete account of the underlying experiment or a guarantee that every other part of the structure is wrong. Conversely, an acceptable local conformation does not independently establish the entire structure’s correctness. The article’s software was not run for this guide.
Sources for this section: [3]
A worked exercise about what a chart can prove
Exercise:two fictional student models produce points at the same place on a conformation chart. One model has a different bond-angle assumption;the other has missing experimental support elsewhere in the chain. A student says the matching points prove both complete structures are correct. Identify two missing comparisons and explain what the shared point actually establishes.
Suggested answer:check the coordinate convention and whether the reference regions were constructed for the same geometry and residue assumptions. Then examine independent evidence and other validation diagnostics for each full model. A shared plotted location records the selected local angular description;it does not supply missing experimental observations. The example is an original reasoning exercise, not an analysis of a deposited protein or a numerical reproduction of the 1963 map.
Read the paper as a route from question to test
A practical reading order is definitions, assumptions, calculated restrictions, comparison with known structures and stated further work. The paper’s closing discussion identifies questions for subsequent investigation rather than presenting every possibility as settled. The educational value is a method for judging claims:ask which part is measured, which is calculated and which follows only under the model’s assumptions. The accompanying figure is an original evidence map, not a copied contour plot or an experimentally measured set of protein angles.
Keep the historical contribution and later applications connected
Ramachandran’s work grew from crystallography and collagen research within institutions at Madras and IISc. Later scientists made conformation checks part of wider structural-biology practice. Preserving the original collaboration and definitions lets a reader see both continuity and change. A modern validation tool can inherit an important idea without using an unchanged 1963 boundary or reducing all model assessment to one graph.
Connected biographies
People and wider work
1922–2001
G. N. Ramachandran
Physicist, crystallographer and institution builderG. N. Ramachandran applied physics and geometry to molecular structure. His work with Gopinath Kartha, C. Ramakrishnan and V. Sasisekharan connected collagen research to a durable way of testing protein conformations, while he built research centres in India.Read biography
1888–1970
C. V. Raman
Physicist, research leader and institution founderC. V. Raman was an Indian physicist who investigated sound and light, shared experimental work with K. S. Krishnan, and helped build research institutions in Calcutta and Bangalore. His career connects a celebrated discovery with the practical conditions that make scientific work possible.Read biographyQuick answers
Common questions
Primary and institutional sources
How this history was checked
Selected original records and institutional catalogues are linked by section. Access limits are explicit; exercises and figures are original teaching aids. This article was reviewed on 27 October 2026.
- Ramachandran, Ramakrishnan and SasisekharanStereochemistry of Polypeptide Chain Configurations, JMB7,95–99(1963)
- Science Media Centre, IISER PuneThe Ramachandran Map:historical background
- Chenandcolleagues / Acta Crystallographica DMolProbity 2010:published abstract
- Indian Institute of ScienceBirth-centenary institutional account